

Question: Problem 1 Let the joint PDF f ( x , Y ) be represented by the following table of values: , y = - 1
Problem
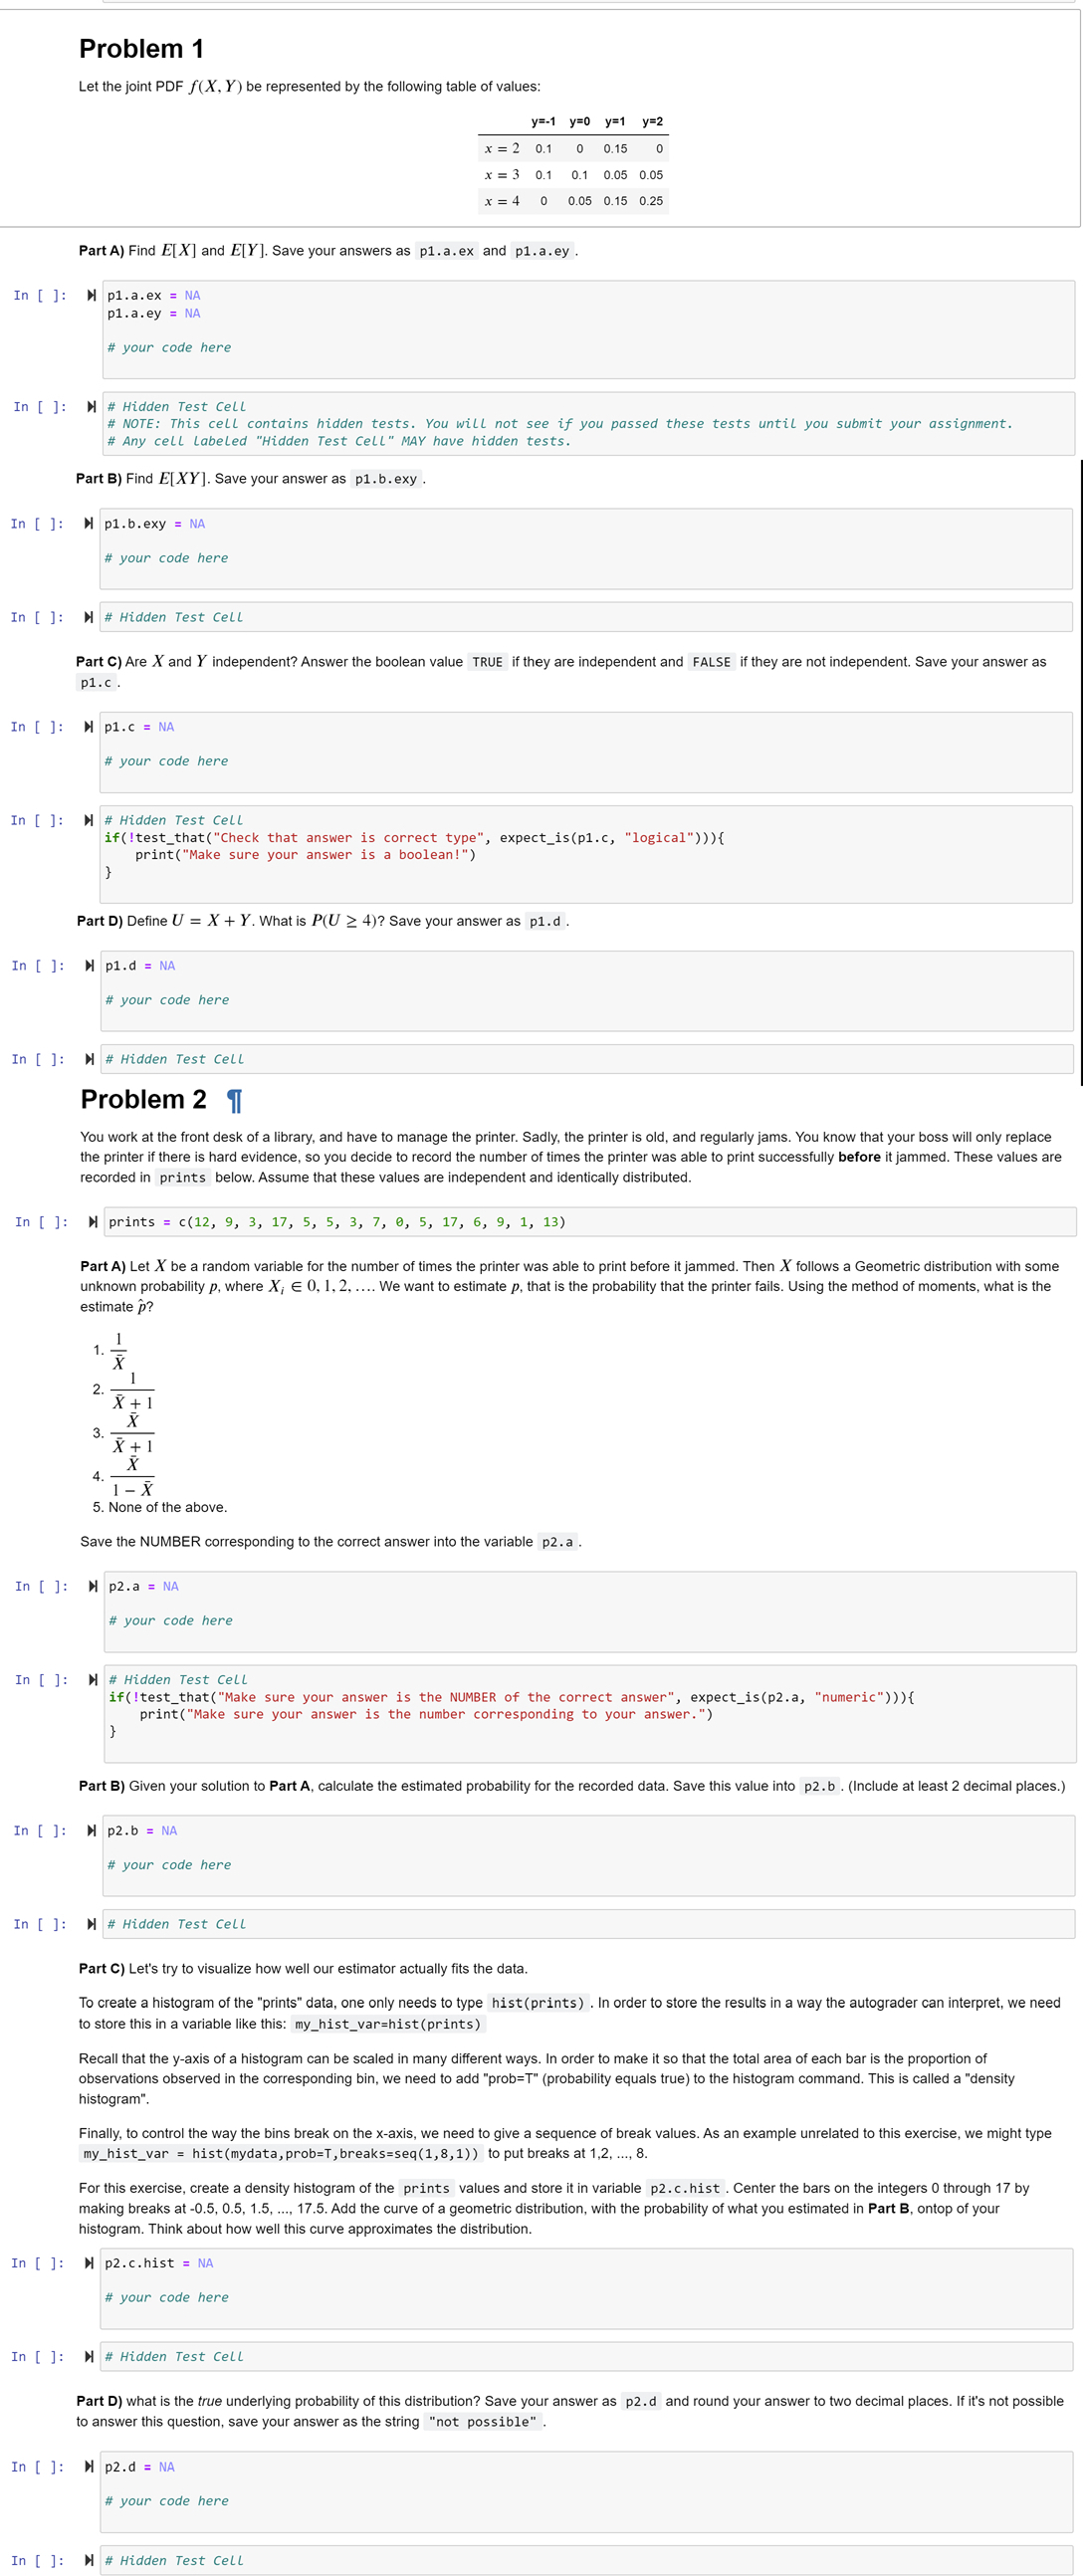
Let the joint PDF be represented by the following table of values:
Part A Find and Save your answers as paex and paey
In :
# your code here
# Hidden Test Cell
# NOTE: This cell contains hidden tests. You will not see if you passed these tests until you submit your assignment.
# Any cell labeled "Hidden Test Cell" MaY have hidden tests.
Part B Find Save your answer as pbexy
v pbexy NA
# your code here
In : # Hidden Test Cell
Part C Are and independent? Answer the boolean value TRUE if they are independent and FALSE if they are not independent. Save your answer as
pc
pc NA
# your code here
# Hidden Test Cell
iftestthatCheck that answer is correct type", expectispc "logical" printMake sure your answer is a boolean!"
Part D Define What is Save your answer as pd
# your code here
# Hidden Test Cell
Problem I
You work at the front desk of a library, and have to manage the printer. Sadly, the printer is old, and regularly jams. You know that your boss will only replace
the printer if there is hard evidence, so you decide to record the number of times the printer was able to print successfully before it jammed. These values are
recorded in prints below. Assume that these values are independent and identically distributed.
prints
Part A Let be a random variable for the number of times the printer was able to print before it jammed. Then follows a Geometric distribution with some
unknown probability where dots. We want to estimate that is the probability that the printer fails. Using the method of moments, what is the
estimate hat
None of the above.
Save the NUMBER corresponding to the correct answer into the variable pa
iftestthatMake sure your answer is the NUMBER of the correct answer", expectispa "numeric"
printMake sure your answer is the number corresponding to your answer."
Part B Given your solution to Part A calculate the estimated probability for the recorded data. Save this value into pb Include at least decimal places.
Part C Let's try to visualize how well our estimator actually fits the data.
To create a histogram of the "prints" data, one only needs to type hist prints In order to store the results in a way the autograder can interpret, we need
to store this in a variable like this: myhistvarhist prints
Recall that the axis of a histogram can be scaled in many different ways. In order to make it so that the total area of each bar is the proportion of
observations observed in the corresponding bin, we need to add "probTprobability equals true to the histogram command. This is called a "density
histogram".
Finally, to control the way the bins break on the axis, we need to give a sequence of break values. As an example unrelated to this exercise, we might type
myhistvar hist mydata prob breaks seq to put breaks at dots,
For this exercise, create a density histogram of the prints values and store it in variable pc hist Center the bars on the integers through by
making breaks at dots, Add the curve of a geometric distribution, with the probability of what you estimated in Part B ontop of your
histogram. Think about how well this curve approximates the distribution.
In : pchist NA
# your code here
In : # Hidden Test cell
Part D what is the true underlying probability of this distribution? Save your answer as pd and round your answer to two decimal places. If it's not possible
to answer this question, save your answer as the string "not possible"
Step by Step Solution
There are 3 Steps involved in it
1 Expert Approved Answer
Step: 1 Unlock

Question Has Been Solved by an Expert!
Get step-by-step solutions from verified subject matter experts
Step: 2 Unlock
Step: 3 Unlock