

Question: Problem 1: Modeling the US Population (23 points) When ecologists analyze population data, they frequently start by finding a function which takes the time as
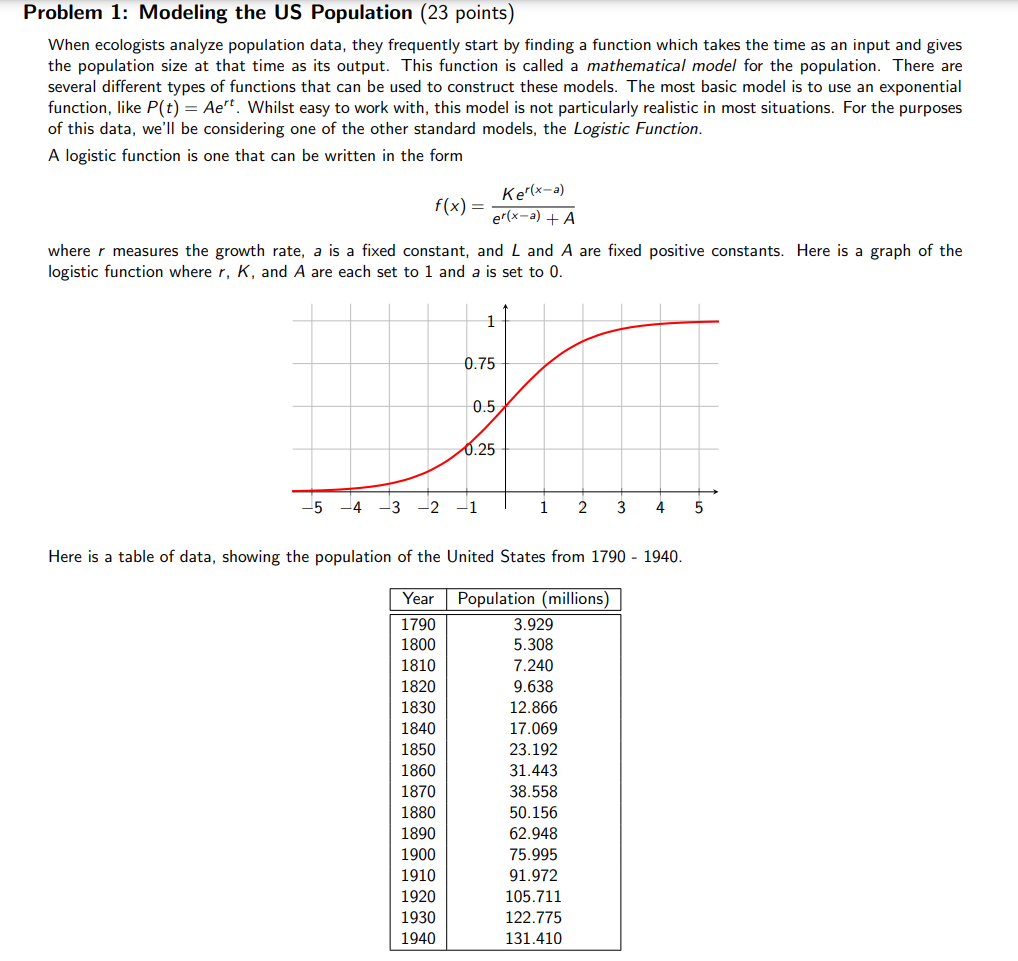
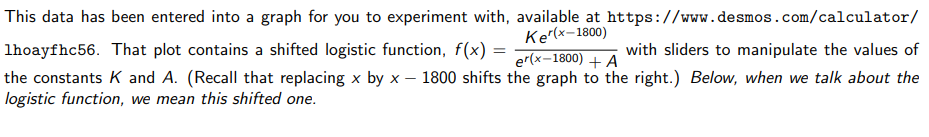

Problem 1: Modeling the US Population (23 points) When ecologists analyze population data, they frequently start by finding a function which takes the time as an input and gives the population size at that time as its output. This function is called a mathematical model for the population. There are several different types of functions that can be used to construct these models. The most basic model is to use an exponential function, like P(t) = Ae". Whilst easy to work with, this model is not particularly realistic in most situations. For the purposes of this data, we'll be considering one of the other standard models, the Logistic Function. A logistic function is one that can be written in the form f(x) = where r measures the growth rate, a is a fixed constant, and L and A are fixed positive constants. Here is a graph of the Ker(x a} eflx=2) + A logistic function where r, K, and A are each set to 1 and a is set to 0. + dg o d3 2 Here is a table of data, showing the population of the United States from 1790 - 1940. + | + -1 | Year Population (millions) 1790 1800 1810 1820 1830 1840 1850 1860 1870 1880 1890 1900 1910 1920 1930 1940 3.929 5.308 7.240 9.638 12.866 17.069 23.192 31.443 38.558 50.156 62.948 75.995 91.972 105.711 122.775 131.410 This data has been entered into a graph for you to experiment with, available at https://www.desmos.com/calculator/ Ker(xl} ef(x1800) + A the constants K and A. (Recall that replacing x by x 1800 shifts the graph to the right.) Below, when we talk about the logistic function, we mean this shifted one. lhoayfhc56. That plot contains a shifted logistic function, f(x) = with sliders to manipulate the values of a) Play around with the sliders a bit. The variables A and K change the logistic function in different ways. We are interested in the 'role' that each variable plays in this process. i) (1 point) Keep the variable K constant and move around the variable A. When you change the A variable, how does this change the resulting graph? Give a brief description. i) (1 point) Now keep the variable A constant and move around the variable K. When you change the K variable, how does this change the resulting graph? Give a brief description. iii) (1 point) Make up a name for the A variable and the K variable that you think describes their roles. There are no wrong answers for names. We want you to be creative and descriptive! b) (2 points) Experiment with the sliders to find values for K and A so that the logistic function matches the data as close as you can make it. What values of K and A did you find to make the logistic function match (as close as possible) the population data? b) (2 points) Experiment with the sliders to find values for K and A so that the logistic function matches the data as close as you can make it. What values of K and A did you find to make the logistic function match (as close as possible) the population data? c) (2 points) What is the formula for the resulting logistic function, after you plug in your values for K and A? This function is your model for the population. For the remainder of Problem 1, you may use an online calculation tool ( such as WolframAlpha, Desmos, ... ) or other mathematics-based software (such as Maple, Matlab, Mathematica, ...) to make calculations based on the function you found in Question c. d) (4 points) Find the limit, as t oo, of your model. Explain what this limit means, in the context of population growth. e) (3 points) Write an equation for each horizontal asymptote of your function. Justify each horizontal asymptote by citing a relevant limit. If there are no horizontal asymptotes, explain why. f) (3 points) Use your model to estimate the population in the United States in 2010. g) (3 points) The actual population in the year 2010 was 308.745 million (according to the 2010 US Census). Does this agree with the model you found? Why do you think that's the case? h) (3 points) Describe the technology you used to make your graphs and calculations (i.e. Wolframalpha, Desmos, Excel, wrote a program in java, ... ). Do you think it was helpful in understanding the situation posed by these questions? What kind of questions do you think it might help you address the future? (Not the specific calculations that were setup, but the software itself.)
Step by Step Solution
There are 3 Steps involved in it

Get step-by-step solutions from verified subject matter experts