

Question: Problem 1 . P chart problem: The dean assistant collected 50 student files every day and recorded number of files with errors for 6-day period.
Problem 1. P chart problem:
The dean assistant collected 50 student files every day and recorded number of files with errors for 6-day period.
| Sample- Days | Number of files reviewed | Number of files w/ typing errors | p-values |
| 1 | 50 | 17 |
|
| 2 | 50 | 9 |
|
| 3 | 50 | 12 |
|
| 4 | 50 | 15 |
|
| 5 | 50 | 26 |
|
| 6 | 50 | 11 |
|
a. Find the average proportion of errors (p-bar). Find the standard deviation (sigma_p).
Find the 3 sigma upper and lower control limits for error proportions.
Consider the chart below. Is process in control? Explain.
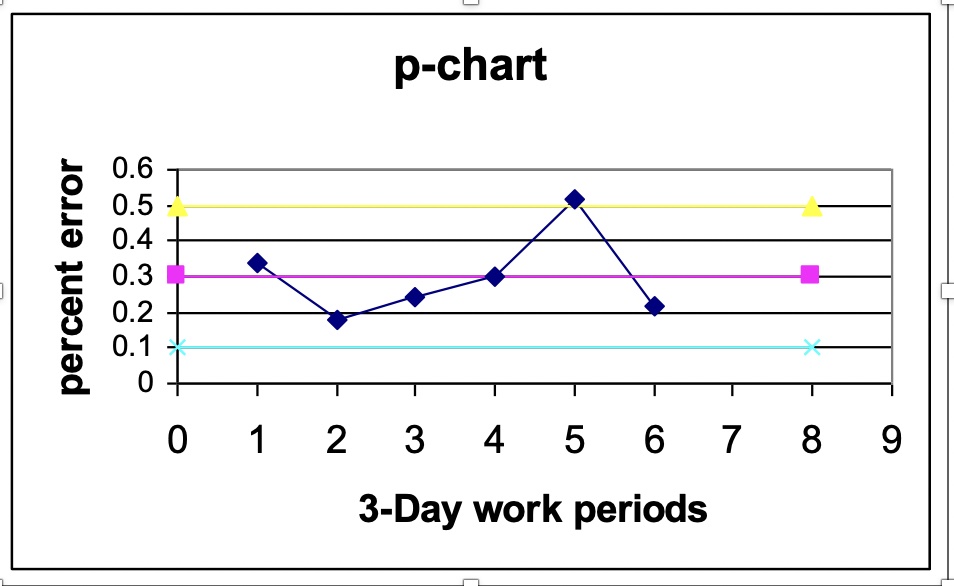
p-chart 3-Day work periods
Step by Step Solution
There are 3 Steps involved in it
1 Expert Approved Answer
Step: 1 Unlock

Question Has Been Solved by an Expert!
Get step-by-step solutions from verified subject matter experts
Step: 2 Unlock
Step: 3 Unlock