

Question: Problem 1: Parta) Build a Vl that iterates every 100ms and plots, on a waveform chart, three periods of a sinusoidal function: y = sin(
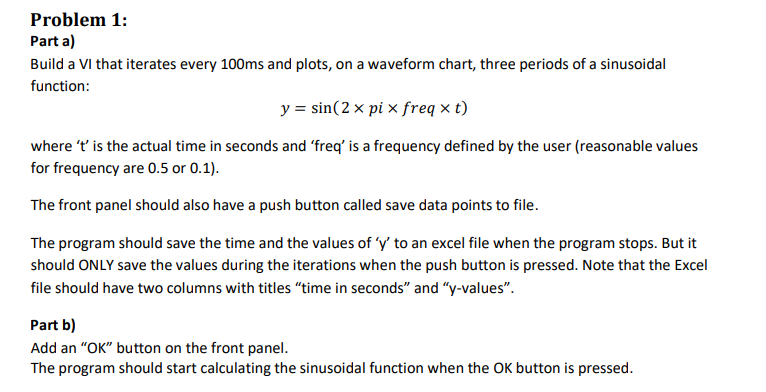
Problem 1: Parta) Build a Vl that iterates every 100ms and plots, on a waveform chart, three periods of a sinusoidal function: y = sin( 2 x pi x freq xt) where 't' is the actual time in seconds and freq' is a frequency defined by the user (reasonable values for frequency are 0.5 or 0.1). The front panel should also have a push button called save data points to file. The program should save the time and the values of 'y' to an excel file when the program stops. But it should ONLY save the values during the iterations when the push button is pressed. Note that the Excel file should have two columns with titles time in seconds and y-values. Part b) Add an "OK" button on the front panel. The program should start calculating the sinusoidal function when the OK button is pressed
Step by Step Solution
There are 3 Steps involved in it

Get step-by-step solutions from verified subject matter experts