

Question: Problem 1 - Practical Skills and FE Exam Question The grain size distribution and Atterberg limits data for Soils 1 , 2 , and 3
Problem Practical Skills and FE Exam Question
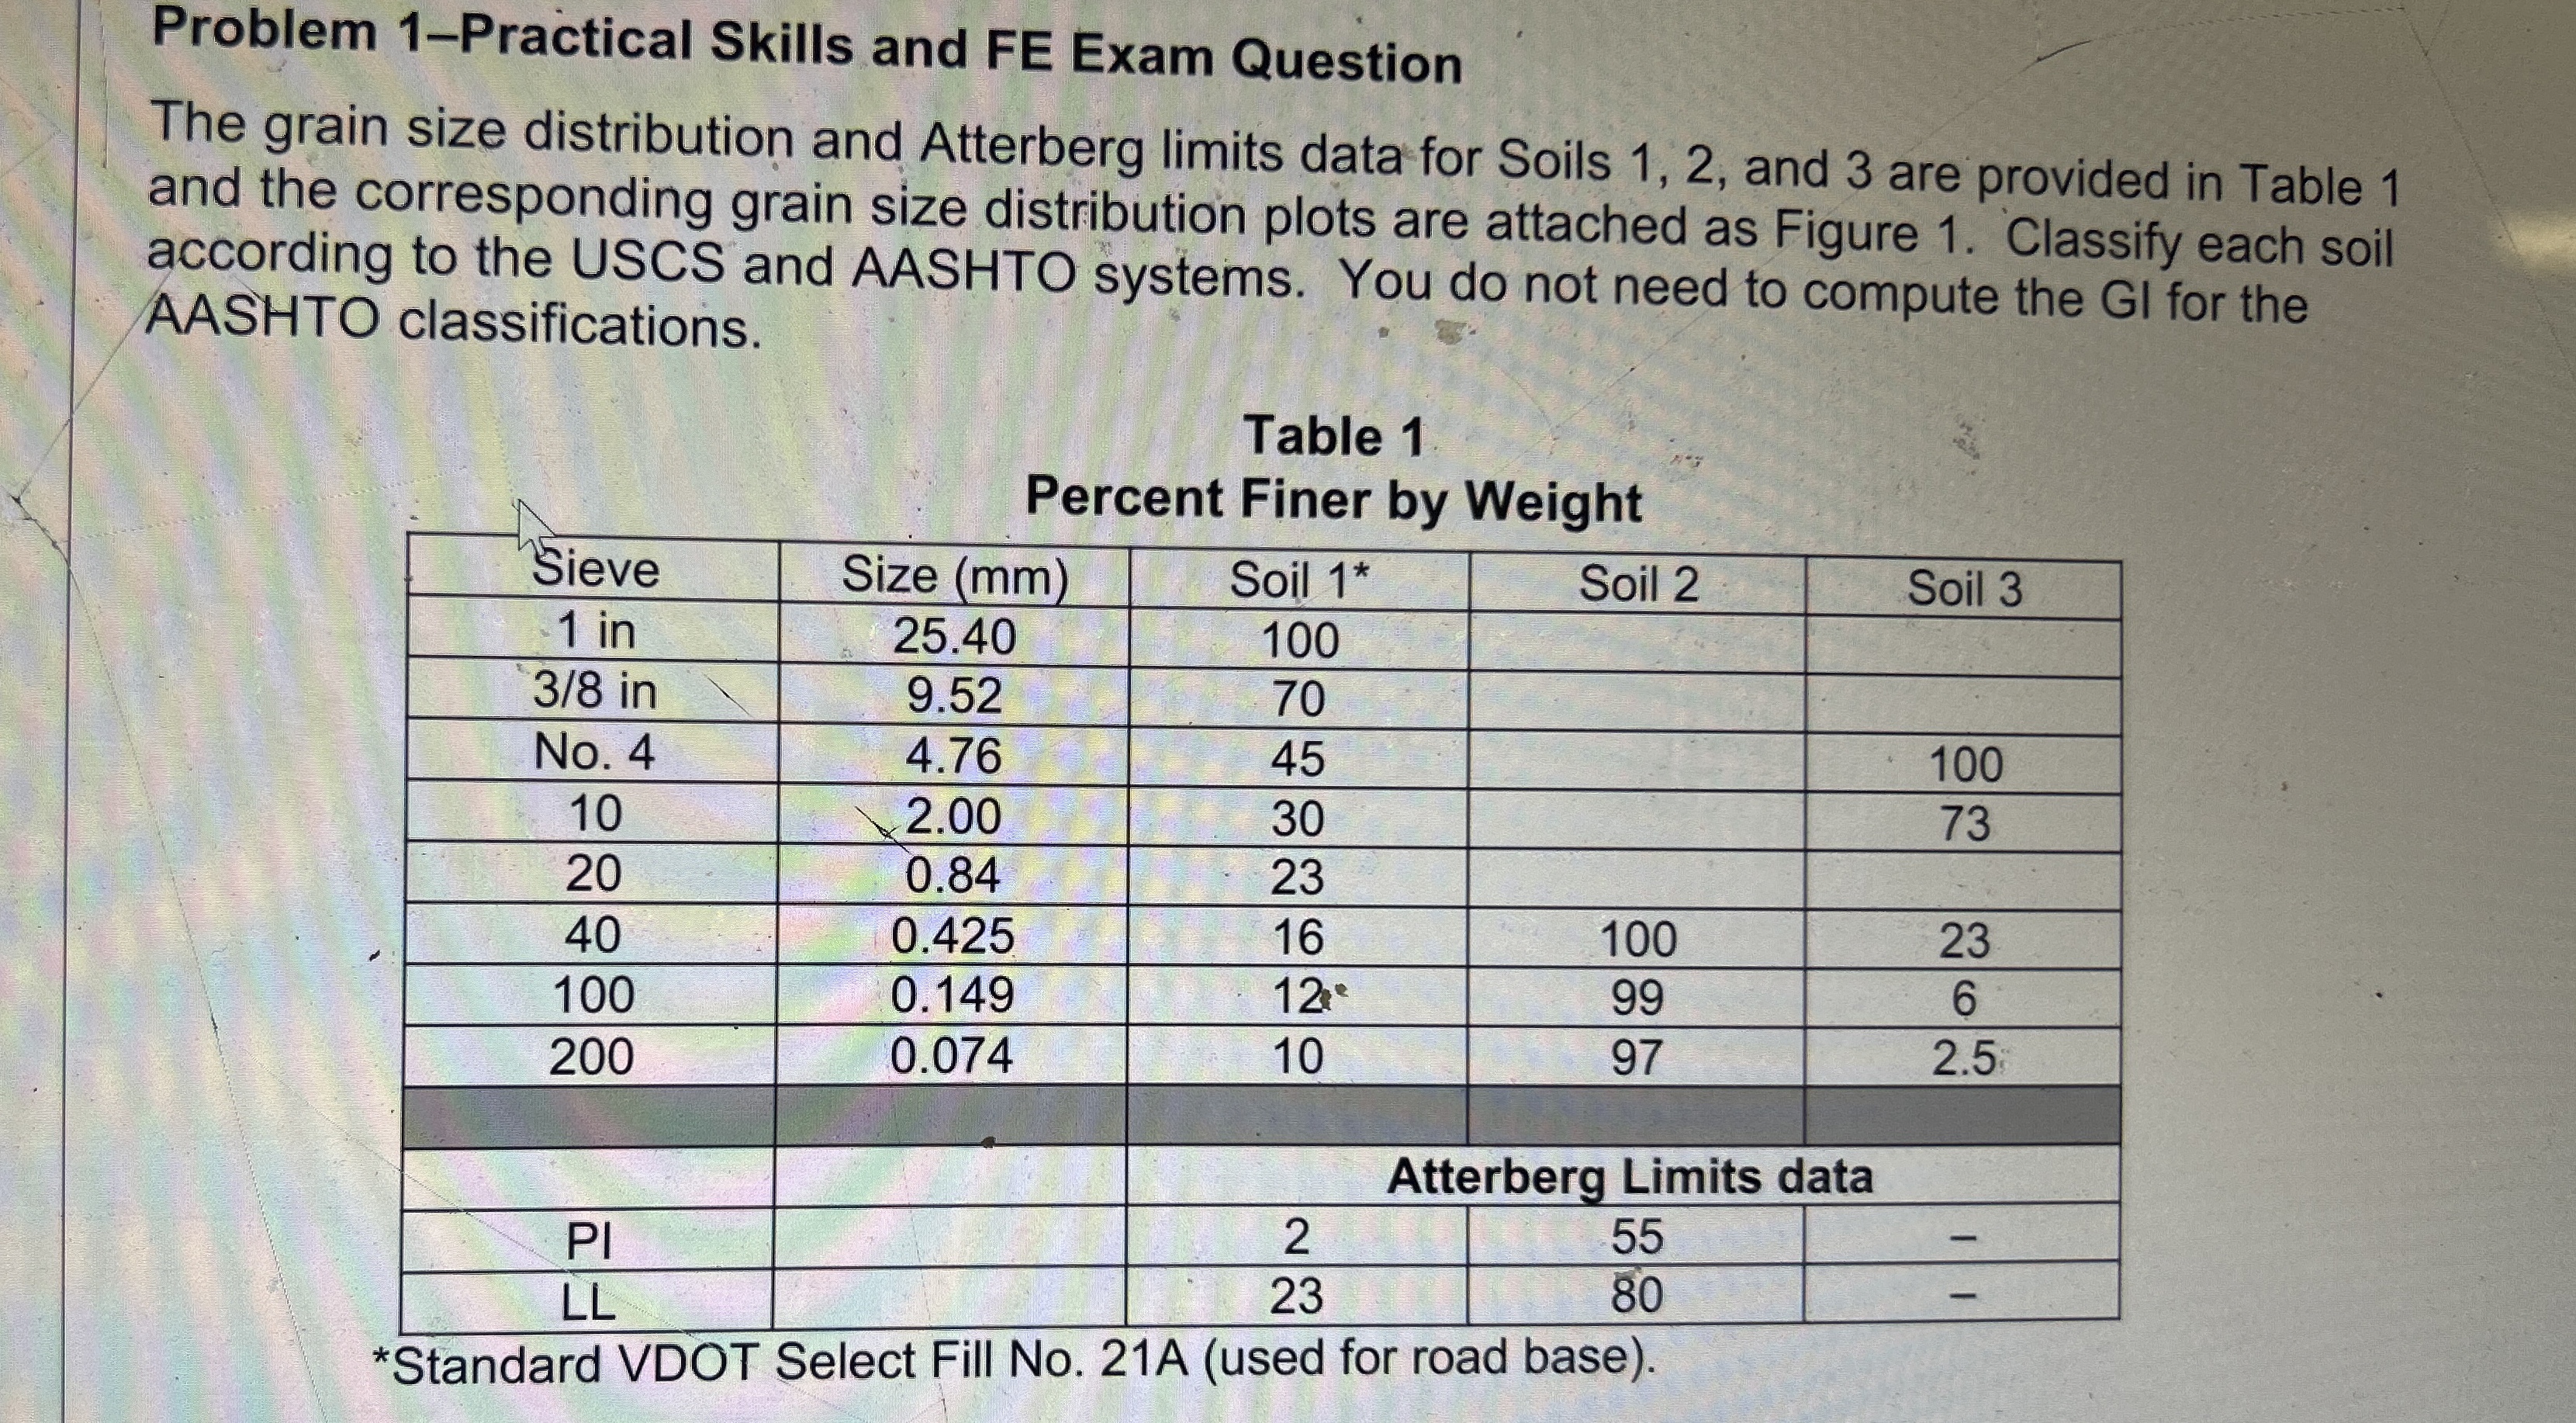
The grain size distribution and Atterberg limits data for Soils and are provided in Table and the corresponding grain size distribution plots are attached as Figure Classify each soil according to the USCS and AASHTO systems. You do not need to compute the GI for the AASHTO classifications.
Table
Percent Finer by Weight
tableSieveSize mmSoil Soil Soil in inNoAtterberg Limits dataPILL
Standard VDOT Select Fill NoA used for road base
Step by Step Solution
There are 3 Steps involved in it
1 Expert Approved Answer
Step: 1 Unlock

Question Has Been Solved by an Expert!
Get step-by-step solutions from verified subject matter experts
Step: 2 Unlock
Step: 3 Unlock