

Question: Problem 1 Provide a graph of Prob. # 8 . 2 0 textbook solution results by plotting a curve or a series of cycles of
Problem
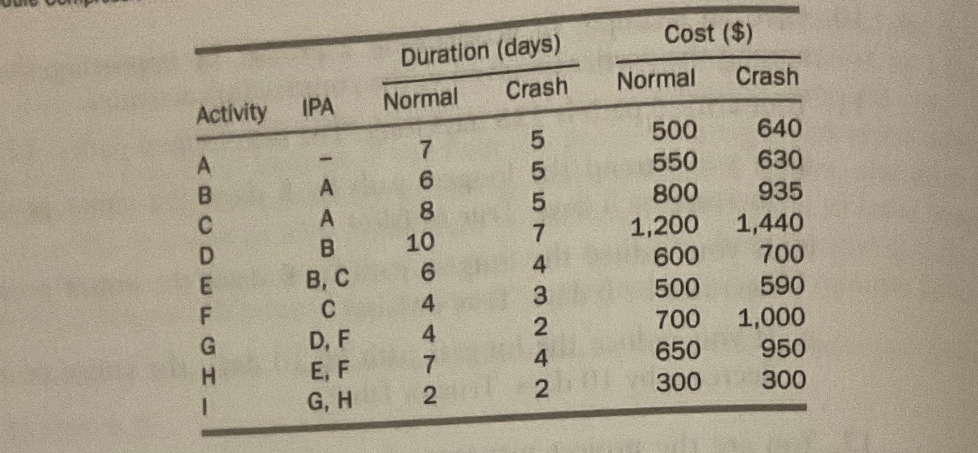
Provide a graph of Prob. # textbook solution results by plotting a curve or a series of cycles of crash in steps, plotting TOTAL COST vs DURATION. Elements of your graph at least should include: ND NC CD CC LCD, and LC along the curve.
Please Plot a graph of the given table.
tableDuration daysCost $ActivityIPA,Normal,Crash,,Normal,CrashABACADBEB CFCGD FHE FIG H
tableDuration daysCost $ActivityIPA,Normal,Crash,,Normal,Crash
Step by Step Solution
There are 3 Steps involved in it
1 Expert Approved Answer
Step: 1 Unlock

Question Has Been Solved by an Expert!
Get step-by-step solutions from verified subject matter experts
Step: 2 Unlock
Step: 3 Unlock