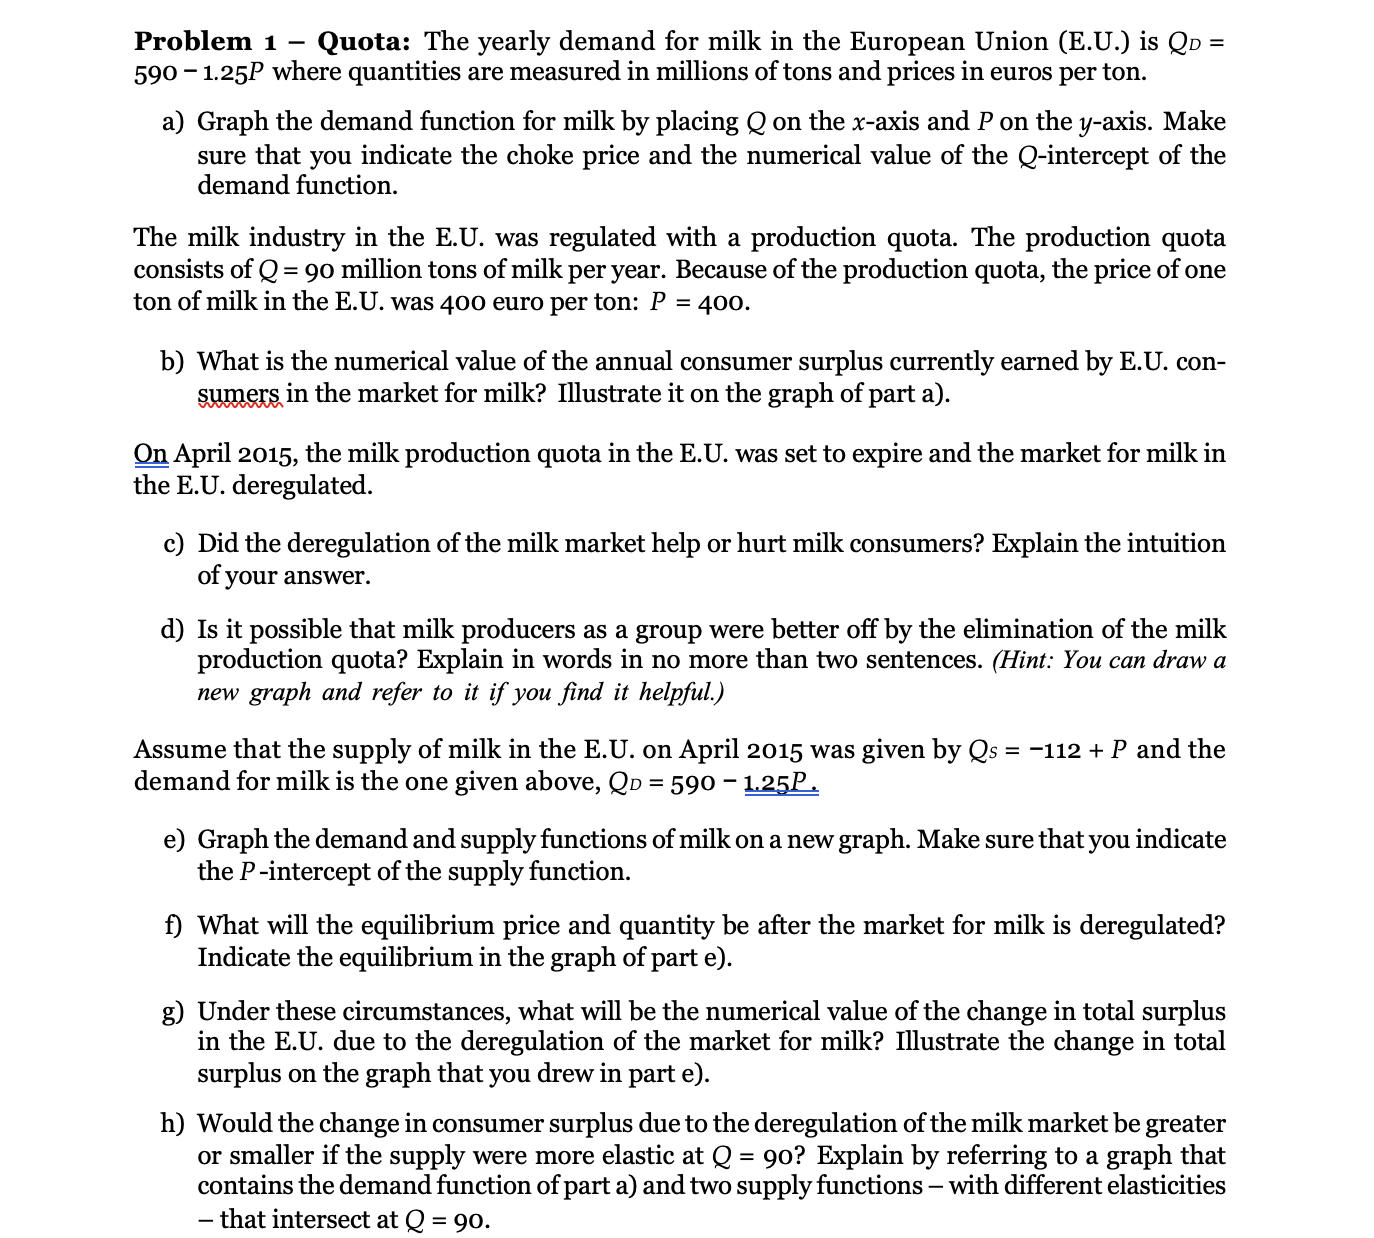
Problem 1 Quota: The yearly demand for milk in the European Union (E.U.) is QD =...
Fantastic news! We've Found the answer you've been seeking!
Question:
Transcribed Image Text:
Problem 1 Quota: The yearly demand for milk in the European Union (E.U.) is QD = 590 -1.25P where quantities are measured in millions of tons and prices in euros per ton. a) Graph the demand function for milk by placing Q on the x-axis and P on the y-axis. Make sure that you indicate the choke price and the numerical value of the Q-intercept of the demand function. The milk industry in the E.U. was regulated with a production quota. The production quota consists of Q = 90 million tons of milk per year. Because of the production quota, the price of one ton of milk in the E.U. was 400 euro per ton: P = 400. b) What is the numerical value of the annual consumer surplus currently earned by E.U. con- sumers in the market for milk? Illustrate it on the graph of part a). On April 2015, the milk production quota in the E.U. was set to expire and the market for milk in the E.U. deregulated. c) Did the deregulation of the milk market help or hurt milk consumers? Explain the intuition of your answer. d) Is it possible that milk producers as a group were better off by the elimination of the milk production quota? Explain in words in no more than two sentences. (Hint: You can draw a new graph and refer to it if you find it helpful.) Assume that the supply of milk in the E.U. on April 2015 was given by Qs = -112 + P and the demand for milk is the one given above, QD = 590 -1.25P. e) Graph the demand and supply functions of milk on a new graph. Make sure that you indicate the P-intercept of the supply function. f) What will the equilibrium price and quantity be after the market for milk is deregulated? Indicate the equilibrium in the graph of part e). g) Under these circumstances, what will be the numerical value of the change in total surplus in the E.U. due to the deregulation of the market for milk? Illustrate the change in total surplus on the graph that you drew in part e). h) Would the change in consumer surplus due to the deregulation of the milk market be greater or smaller if the supply were more elastic at Q = 90? Explain by referring to a graph that contains the demand function of part a) and two supply functions - with different elasticities - that intersect at Q = 90. Problem 1 Quota: The yearly demand for milk in the European Union (E.U.) is QD = 590 -1.25P where quantities are measured in millions of tons and prices in euros per ton. a) Graph the demand function for milk by placing Q on the x-axis and P on the y-axis. Make sure that you indicate the choke price and the numerical value of the Q-intercept of the demand function. The milk industry in the E.U. was regulated with a production quota. The production quota consists of Q = 90 million tons of milk per year. Because of the production quota, the price of one ton of milk in the E.U. was 400 euro per ton: P = 400. b) What is the numerical value of the annual consumer surplus currently earned by E.U. con- sumers in the market for milk? Illustrate it on the graph of part a). On April 2015, the milk production quota in the E.U. was set to expire and the market for milk in the E.U. deregulated. c) Did the deregulation of the milk market help or hurt milk consumers? Explain the intuition of your answer. d) Is it possible that milk producers as a group were better off by the elimination of the milk production quota? Explain in words in no more than two sentences. (Hint: You can draw a new graph and refer to it if you find it helpful.) Assume that the supply of milk in the E.U. on April 2015 was given by Qs = -112 + P and the demand for milk is the one given above, QD = 590 -1.25P. e) Graph the demand and supply functions of milk on a new graph. Make sure that you indicate the P-intercept of the supply function. f) What will the equilibrium price and quantity be after the market for milk is deregulated? Indicate the equilibrium in the graph of part e). g) Under these circumstances, what will be the numerical value of the change in total surplus in the E.U. due to the deregulation of the market for milk? Illustrate the change in total surplus on the graph that you drew in part e). h) Would the change in consumer surplus due to the deregulation of the milk market be greater or smaller if the supply were more elastic at Q = 90? Explain by referring to a graph that contains the demand function of part a) and two supply functions - with different elasticities - that intersect at Q = 90.
Expert Answer:
Answer rating: 100% (QA)
a Graphing the demand function The demand function for milk in the European Union EU is given by QD 590 125P Lets plot this on a graph with Q quantity on the xaxis and P price on the yaxis To find the ... View the full answer
Related Book For
Project Management A Managerial Approach
ISBN: 978-0470533024
8th edition
Authors: Jack R. Meredith, Samuel J. Mantel Jr.
Posted Date:
Students also viewed these economics questions
-
Planning is one of the most important management functions in any business. A front office managers first step in planning should involve determine the departments goals. Planning also includes...
-
In Hollywood, most nightclubs hire promoters, or people who walk around near the nightclub and try to convince passersby to enter the club. One of the nightclub owners asked a marketing consultant to...
-
A sales invoice included the following information: merchandise price, $12,000; terms 1/10, n/eom, FOB shipping point with prepaid freight of $900 added to the invoice. Assuming that a credit for...
-
Alpena Company reported the following operating results for 2019 and 2018. _________________________________2019 2018 Sales.......................................... $250,000.........................
-
Go to the Society of Human Resource Managements website at www.shrm.org. Research the services they provide to their membership and the different options for student membership. Find a contact for...
-
Consider the model \(y_{i}=\beta_{1} x_{i}+\varepsilon_{i}\), that is, regression with one explanatory variable without the intercept term. This model is called regression through the origin because...
-
1. Based on Guz, can the implied covenant of good faith and fair dealing apply to any conditions not actually stated in a contract? In other words, can the covenant apply to anything beyond that...
-
Evaluate the definite integral (11 sin a) da exactly, using the Fundamental Theorem, then evaluate the same integral approximately. NOTE: Round the approximate value to three decimal places. Example:...
-
What does the normal distribution tell us about intelligence? (1 Point) There are a small, but unpredictable number of people of high intelligence There are a large, but predictable number of people...
-
Read ALDO'S GLOBAL OMNICHANNEL IMPERATIVE case study. q1 - develop a social media integration strategy for Aldo and explain how aldo can leverage social media touchpoints to improve its digital...
-
1. What is the purpose of prioritising traffic within a routed environment? 2. What network services are essential within a network? 3. Why is documentation essential within Company Networks? 4. What...
-
What is the loophole in the 13th Amendment and explain how it is used to the detriment of African Americans in the United States?
-
September 2021, Australia cancelled a $90mAUD submarine deal with France following the announcement of AUKUS, a security-pact alliance between the USA, UK, and Australia. Do some further research on...
-
How can you apply small group communication in your own life? What you've learned about small group communication can impact your social and intimate life? Please include conclusion and show an...
-
What is the Jordan Cycle vector, J1? 1 -4 A : 1 -3 Using the Jordan Cycle, what is the general solution to the system = A ? dt What is x(t)? What is (x(0))-?
-
One Way Cellular accountants have assembled the following data for the year ended September 30, 2014: Prepare the operating activities section using the indirect method for One Way Cellulars...
-
Draw a hierarchy/organization chart illustrating your interpretation of the various control systems/programs described in the writeup.
-
Might milestones and phase-gates both occur at the same point of a project? Will the same activities be happening?
-
If you were the project manager, what characteristics would you be looking for in the new control system? Will a new control system be adequate for the problem? Will it control scope creep? Explain....
-
The information has been taken from the companys books as at 31 December 20X1, but the following has not been allowed for. (a) Inventory at the end of the year is 25,000. (b) Audit fees owing...
-
On the issue of going concern in the context of IAS 1: A. Entities must be assumed to last no longer than 12 months. B. Entities can be assumed to last for 12 months, but accountants must not assume...
-
The two key qualities of accounting information are (according to the IASB): A. Prudence and verifiability. B. Representational faithfulness and reliability. C. Representational faithfulness and...
Study smarter with the SolutionInn App