

Question: Problem 1 : Scientists use an instrument called an oscilloscope to visualize and measure electrical signals. These signals can come from devices that measure physical
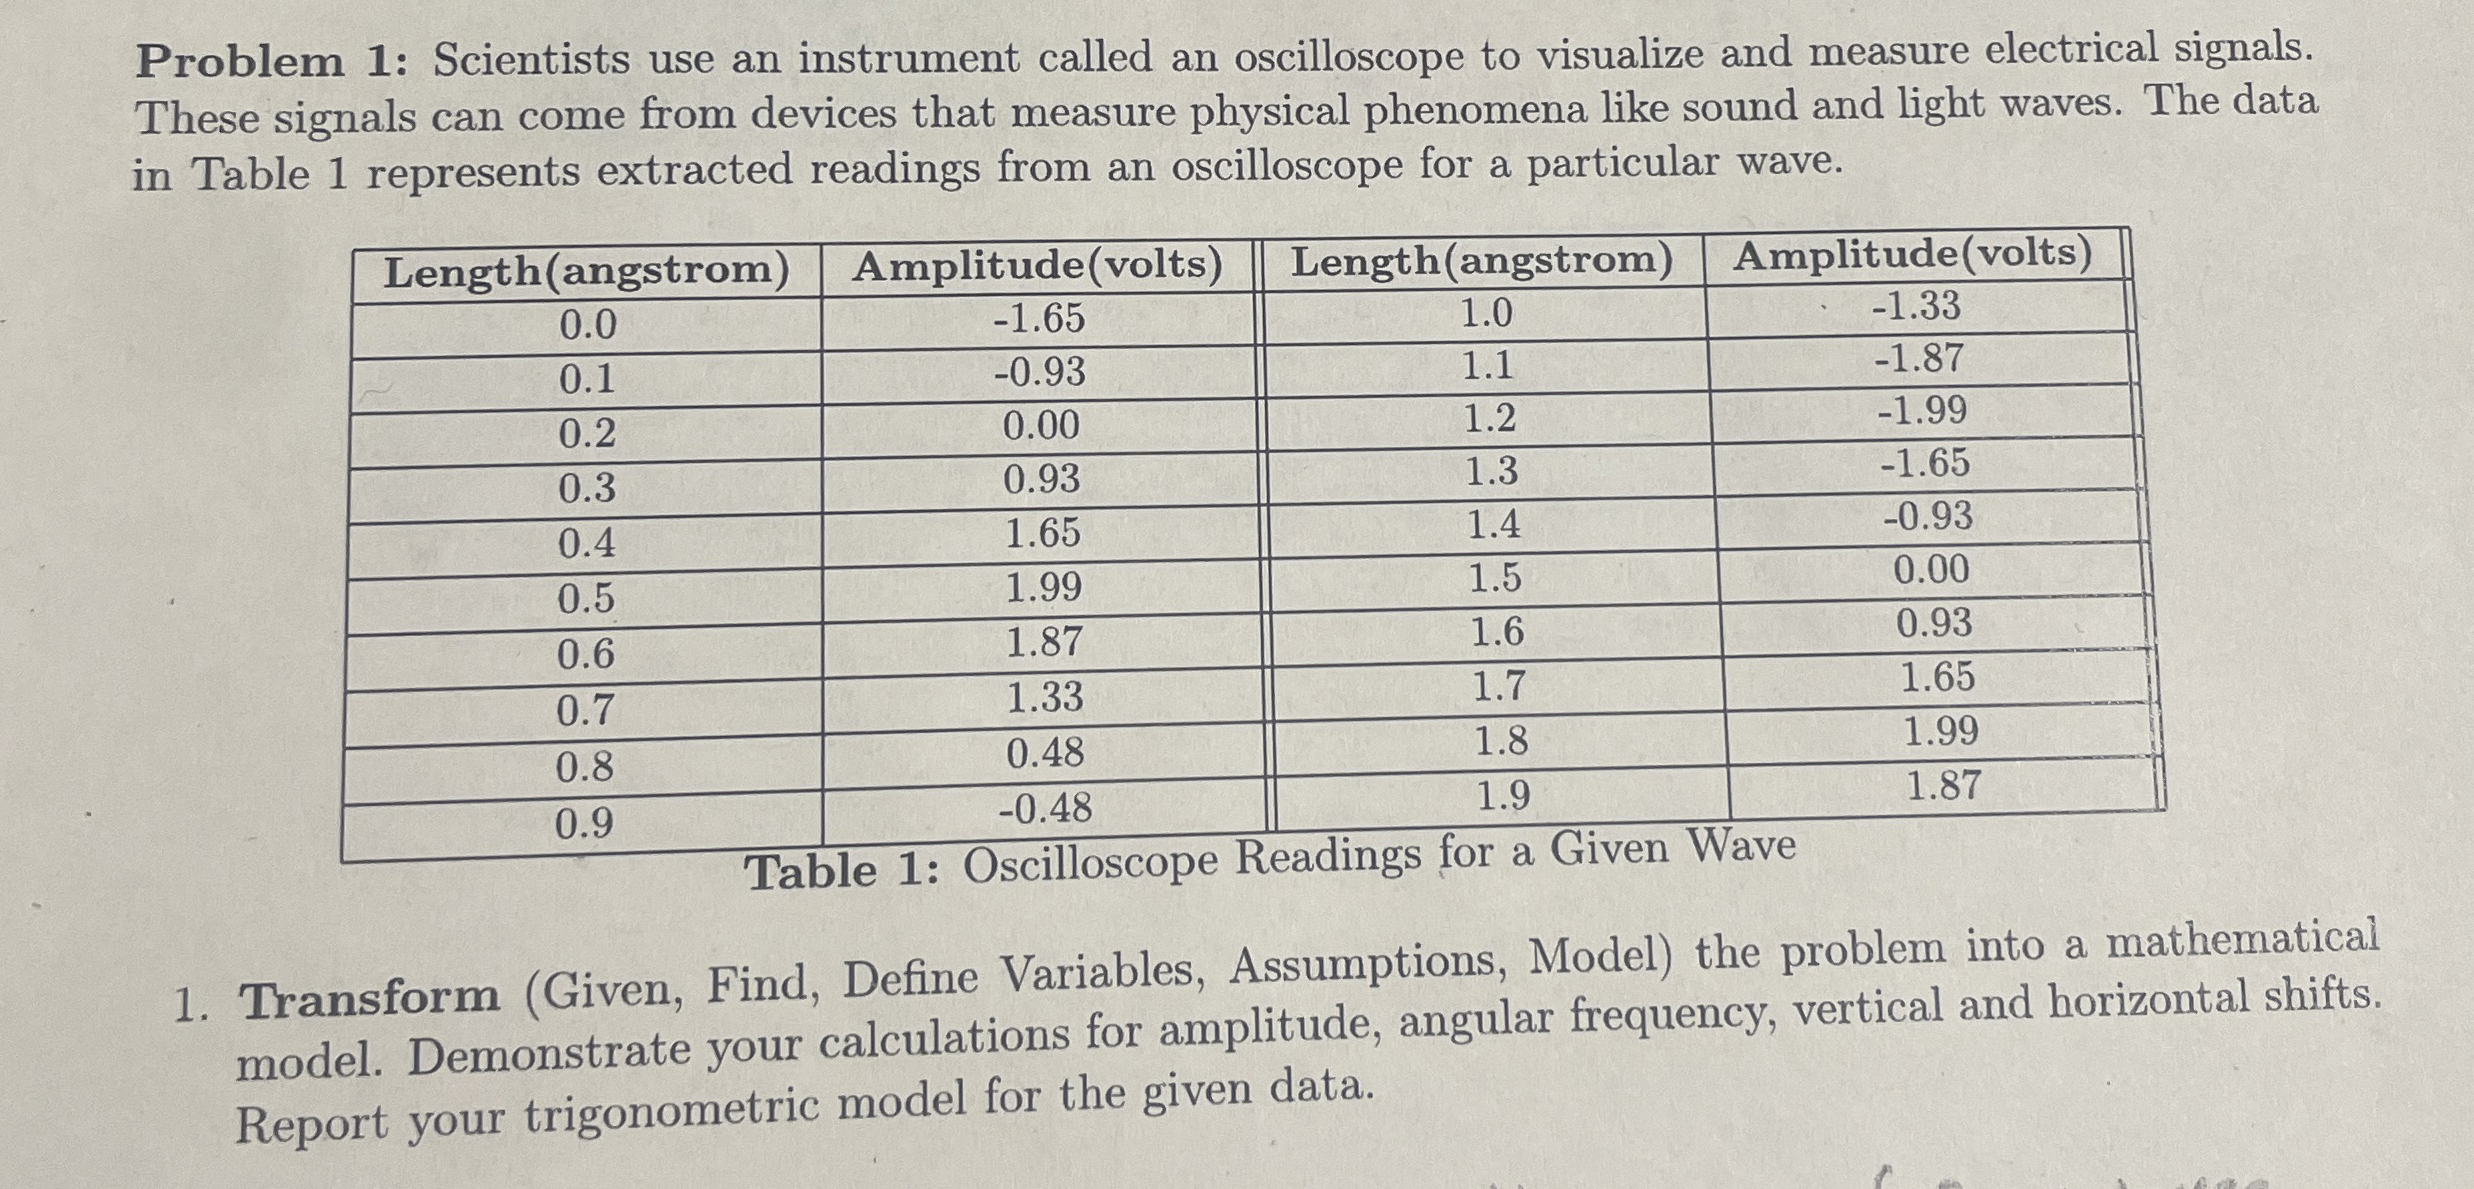
Problem : Scientists use an instrument called an oscilloscope to visualize and measure electrical signals. These signals can come from devices that measure physical phenomena like sound and light waves. The data in Table represents extracted readings from an oscilloscope for a particular wave.
tableLengthangstromAmplitudevoltsLengthangstromAmplitudevolts
Table : Oscilloscope Readings for a Given Wave
Transform Given Find, Define Variables, Assumptions, Model the problem into a mathematical model. Demonstrate your calculations for amplitude, angular frequency, vertical and horizontal shifts. Report your trigonometric model for the given data.
Step by Step Solution
There are 3 Steps involved in it
1 Expert Approved Answer
Step: 1 Unlock

Question Has Been Solved by an Expert!
Get step-by-step solutions from verified subject matter experts
Step: 2 Unlock
Step: 3 Unlock