

Question: Problem 1 The data on the SPSS file contain the stock prices of four companies, collected weekly for 53 consecutive weeks, ending May 22,
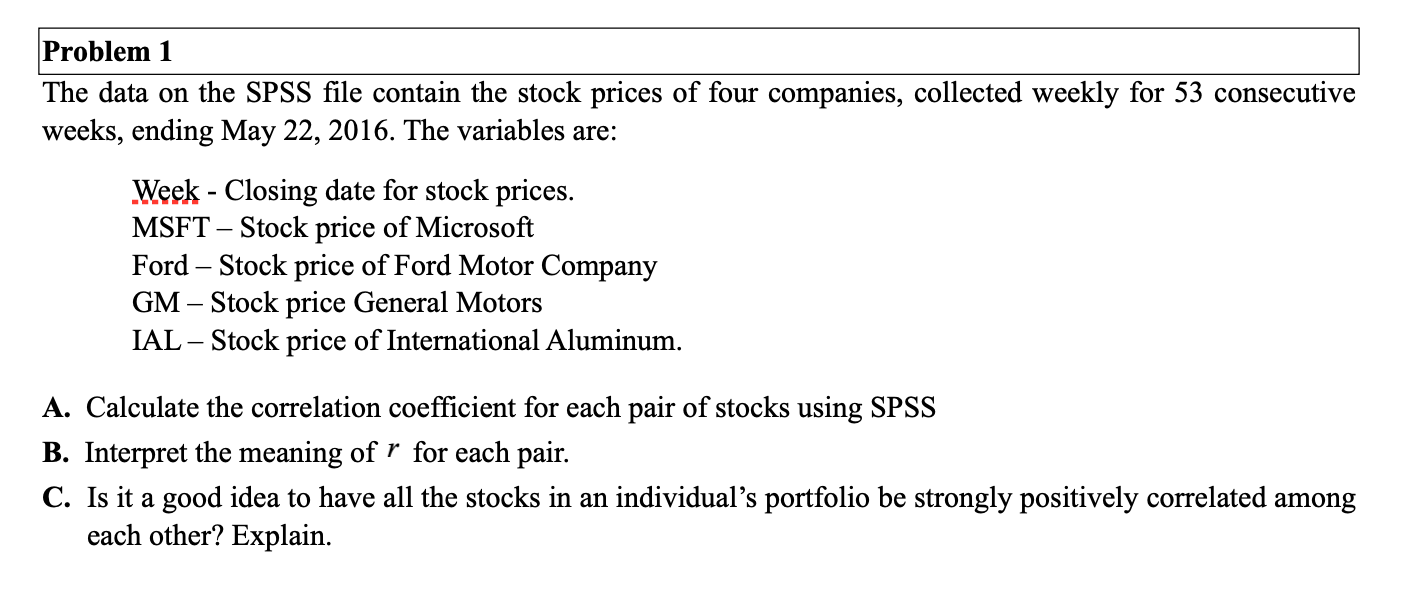
Problem 1 The data on the SPSS file contain the stock prices of four companies, collected weekly for 53 consecutive weeks, ending May 22, 2016. The variables are: Week - Closing date for stock prices. MSFT - Stock price of Microsoft Ford Stock price of Ford Motor Company _ GM-Stock price General Motors IAL - Stock price of International Aluminum. A. Calculate the correlation coefficient for each pair of stocks using SPSS B. Interpret the meaning of r for each pair. C. Is it a good idea to have all the stocks in an individual's portfolio be strongly positively correlated among each other? Explain.
Step by Step Solution
There are 3 Steps involved in it

Get step-by-step solutions from verified subject matter experts