

Question: problem 1 The distribution of a random variable, X, is shown in the histogram below: Problem 1 [20 Pts] The distribution of a random variable,
problem 1 The distribution of a random variable,
X, is shown in the histogram below:
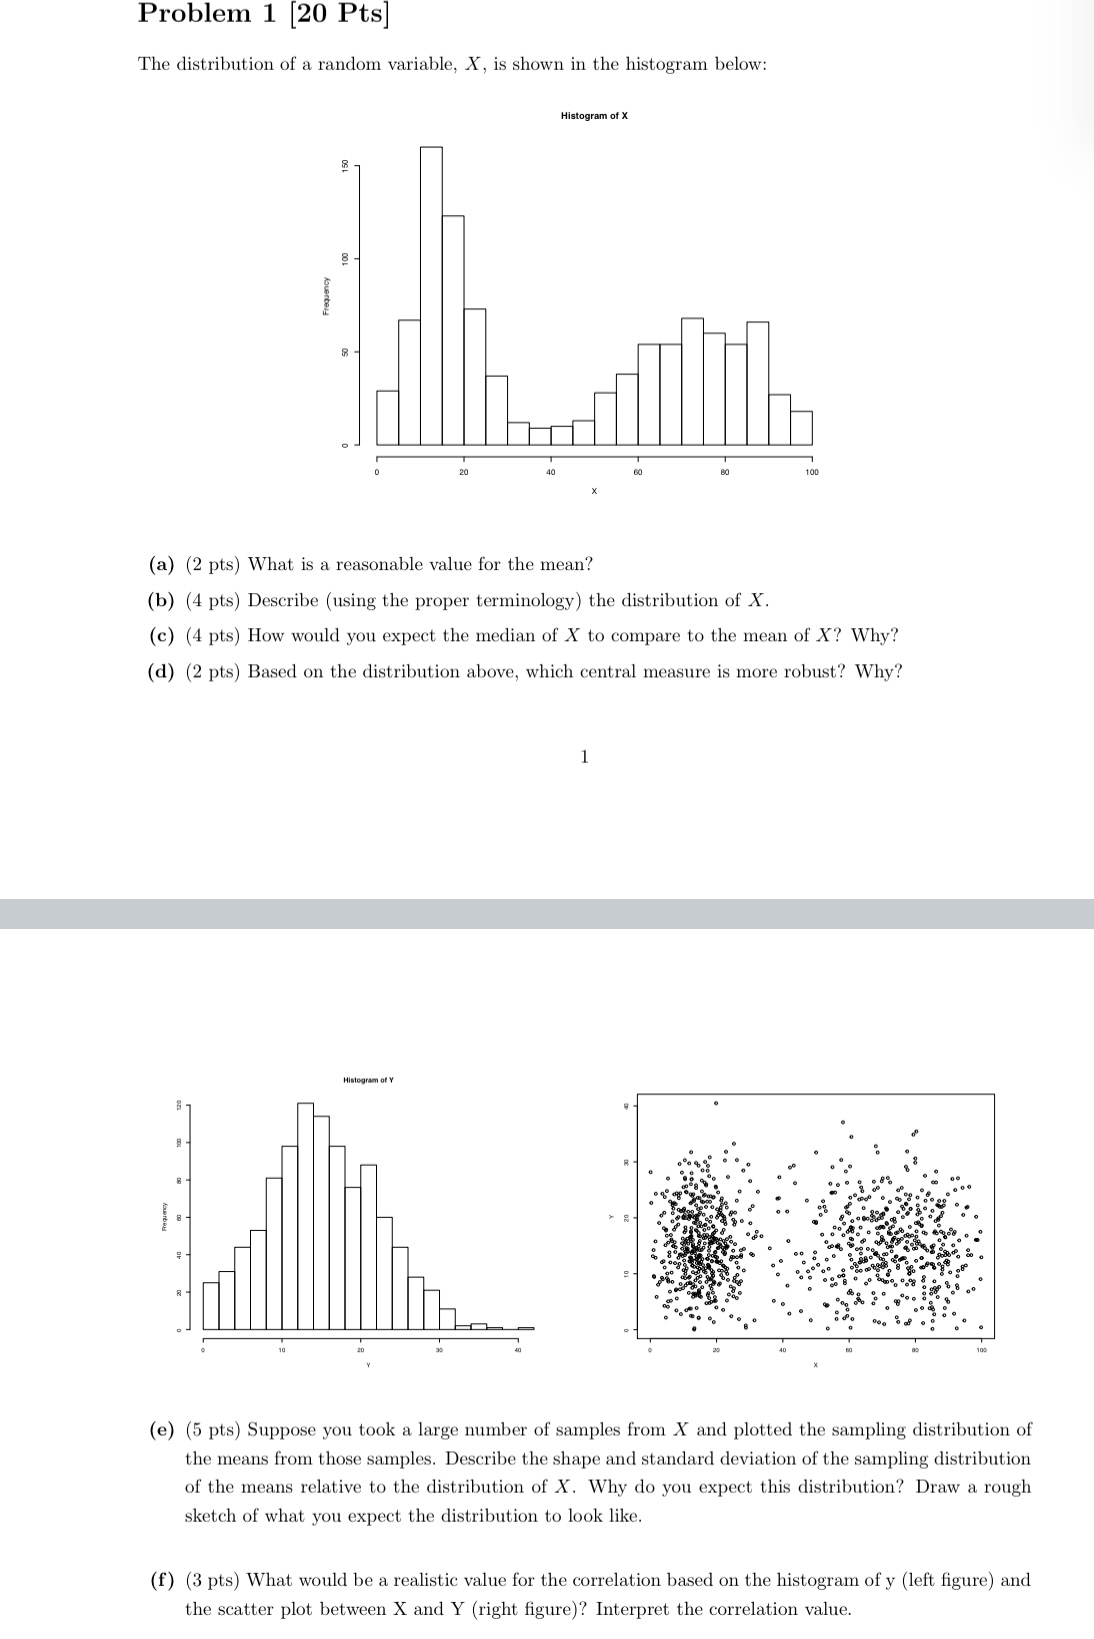
Problem 1 [20 Pts] The distribution of a random variable, X, is shown in the histogram below: I'll-hum of K an m '00 D m 40 X What is a reasonable value for the mean? 4pts ( ) (b) (4 pts) Describe (using the proper terminology) the distribution of X. ( ) How would you expect the median of X to compare to the mean of X? Why? ( l (d) 2 pts Based on the distribution above, which central measure is more robust? Why? amour I'm-w m v (e) (5 pts) Suppose you took a large number of samples from X and plotted the sampling distribution of the means from those samples. Describe the shape and standard deviation of the sampling distribution of the means relative to the distribution of X. Why do you expect this distribution? Draw a rough sketch of what you expect the distribution to look like. (1") (3 pts) What would be a realistic value for the correlation based on the histogram of 3; (left gure) and the scatter plot between X and Y (right gure)? Interpret the correlation value
Step by Step Solution
There are 3 Steps involved in it

Get step-by-step solutions from verified subject matter experts