

Question: Problem 1 The gure illustrates two sampling distributions for sample proportions when the population proportion p = 0.50. n = 1000, showing sample proportion very
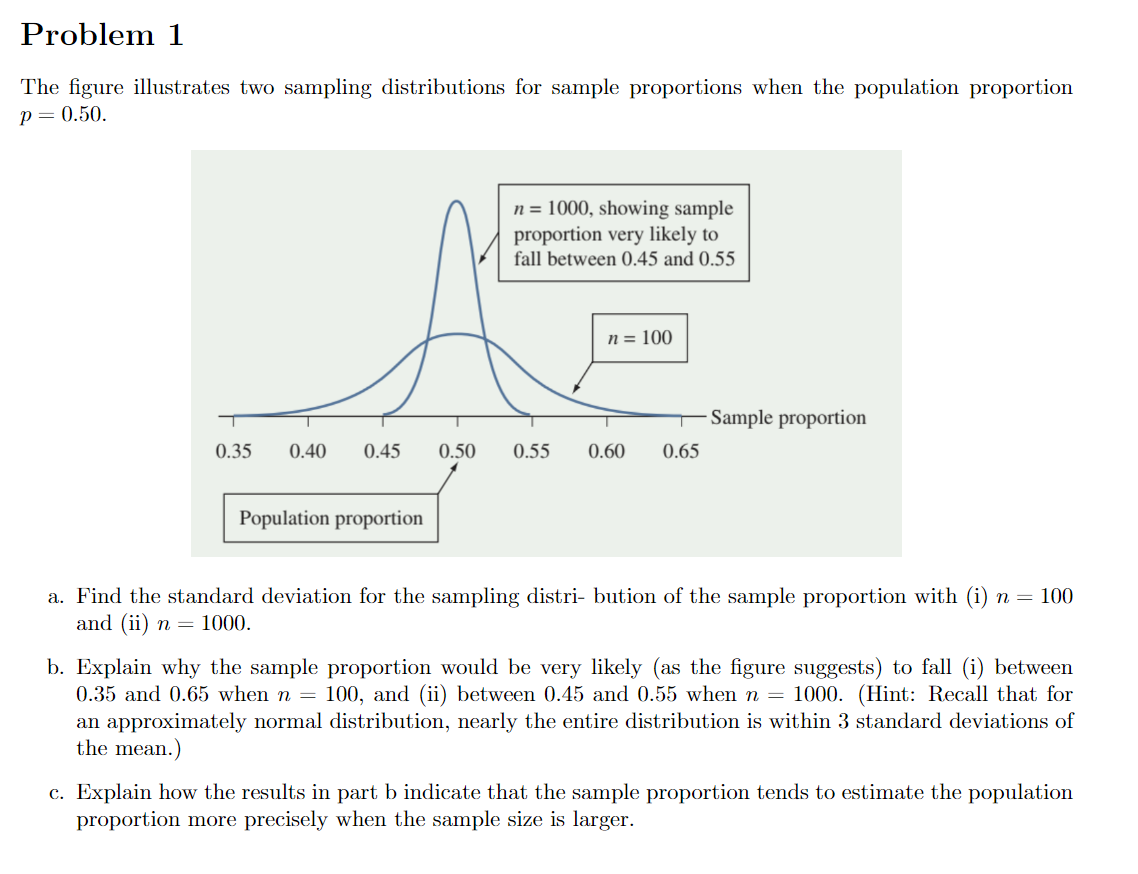
Problem 1 The gure illustrates two sampling distributions for sample proportions when the population proportion p = 0.50. n = 1000, showing sample proportion very likely to fall between 0.45 and 0.55 Sample proportion 0.35 0.40 0.45 0.50 0.55 0.60 0.65 Population proportion a. Find the standard deviation for the sampling distri- bution of the sample proportion with (i) n = 100 b. and (ii) in. = 1000. Explain why the sample proportion would be very likely (as the gure suggests) to fall (i) between 0.35 and 0.55 when n = 100, and (ii) between 0.45 and 0.55 when n = 1000. (Hint: Recall that for an approximately normal distribution, nearly the entire distribution is within 3 standard deviations of the mean.) Explain how the results in part b indicate that the sample proportion tends to estimate the population proportion more precisely when the sample size is larger
Step by Step Solution
There are 3 Steps involved in it

Get step-by-step solutions from verified subject matter experts