

Question: Problem 1 The loop network shown in Figure 1 is part of a new development residential areas. The pipe roughness ( k s ) is
Problem
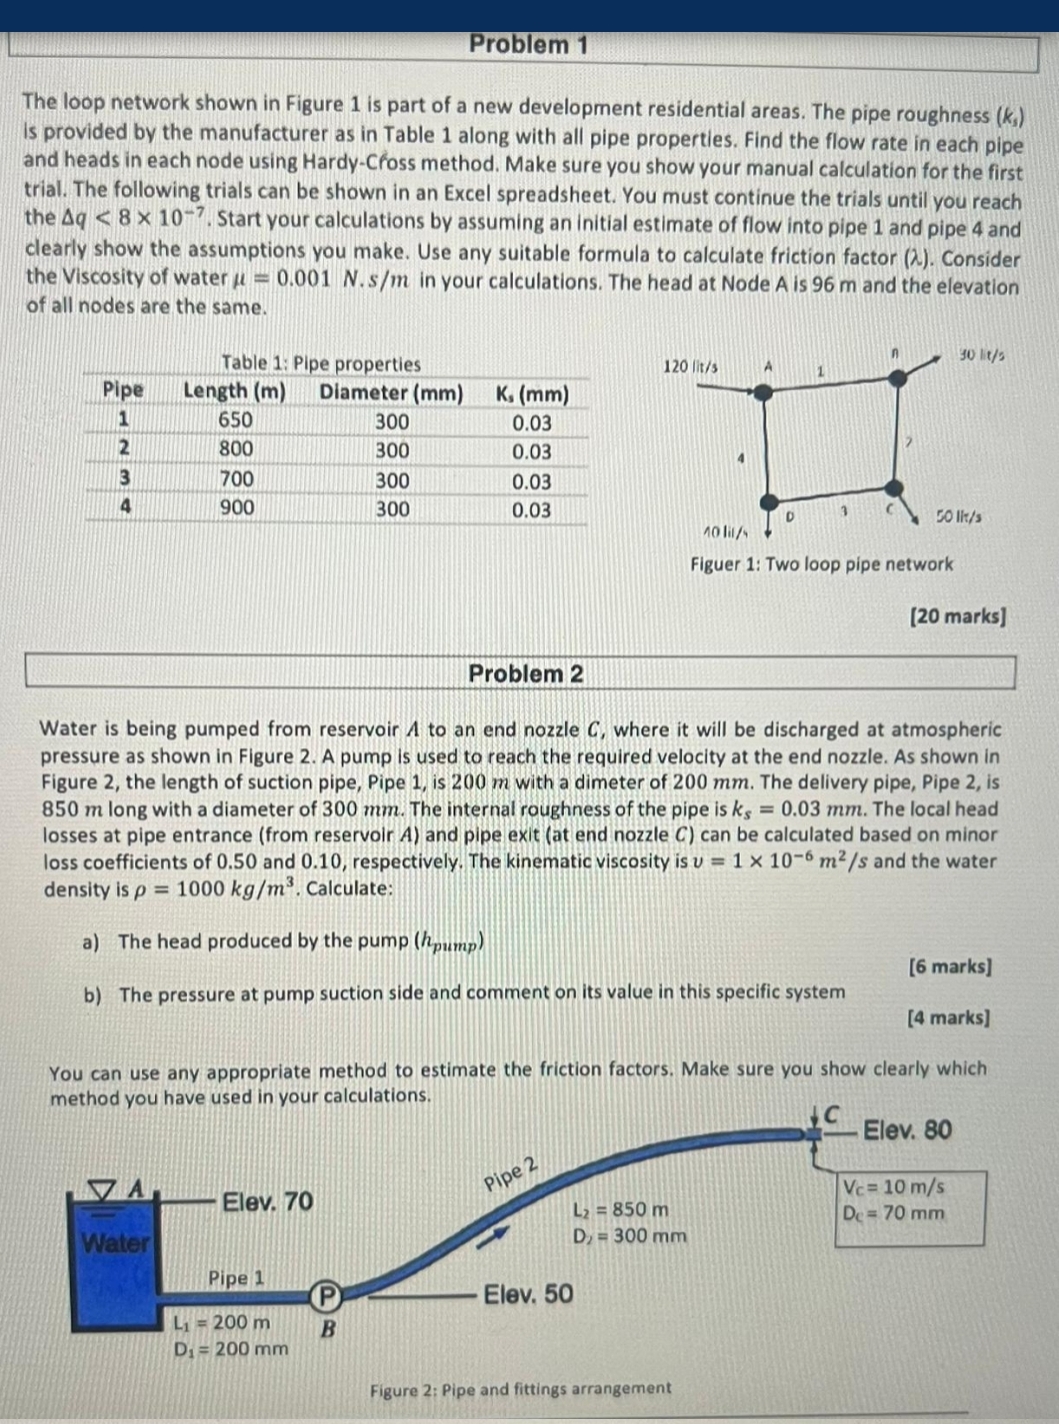
The loop network shown in Figure is part of a new development residential areas. The pipe roughness is provided by the manufacturer as in Table along with all pipe properties. Find the flow rate in each pipe and heads in each node using HardyCfoss method. Make sure you show your manual calculation for the first trial. The following trials can be shown in an Excel spreadsheet. You must continue the trials until you reach the Start your calculations by assuming an initial estimate of flow into pipe and pipe and clearly show the assumptions you make. Use any suitable formula to calculate friction factor Consider the Viscosity of water in your calculations. The head at Node A is and the elevation of all nodes are the same.
Table : Pipe properties
tablePipeLength Diameter
I want both answers in detail and i wanI want it urgently please do it fast
Step by Step Solution
There are 3 Steps involved in it
1 Expert Approved Answer
Step: 1 Unlock

Question Has Been Solved by an Expert!
Get step-by-step solutions from verified subject matter experts
Step: 2 Unlock
Step: 3 Unlock