Question: Problem 1 (This is based on Week 1 videos) The (GRE) and the (MAT) are tests that graduate schools use to evaluate applicants. GRE scores

Problem 1 (This is based on Week 1 videos)

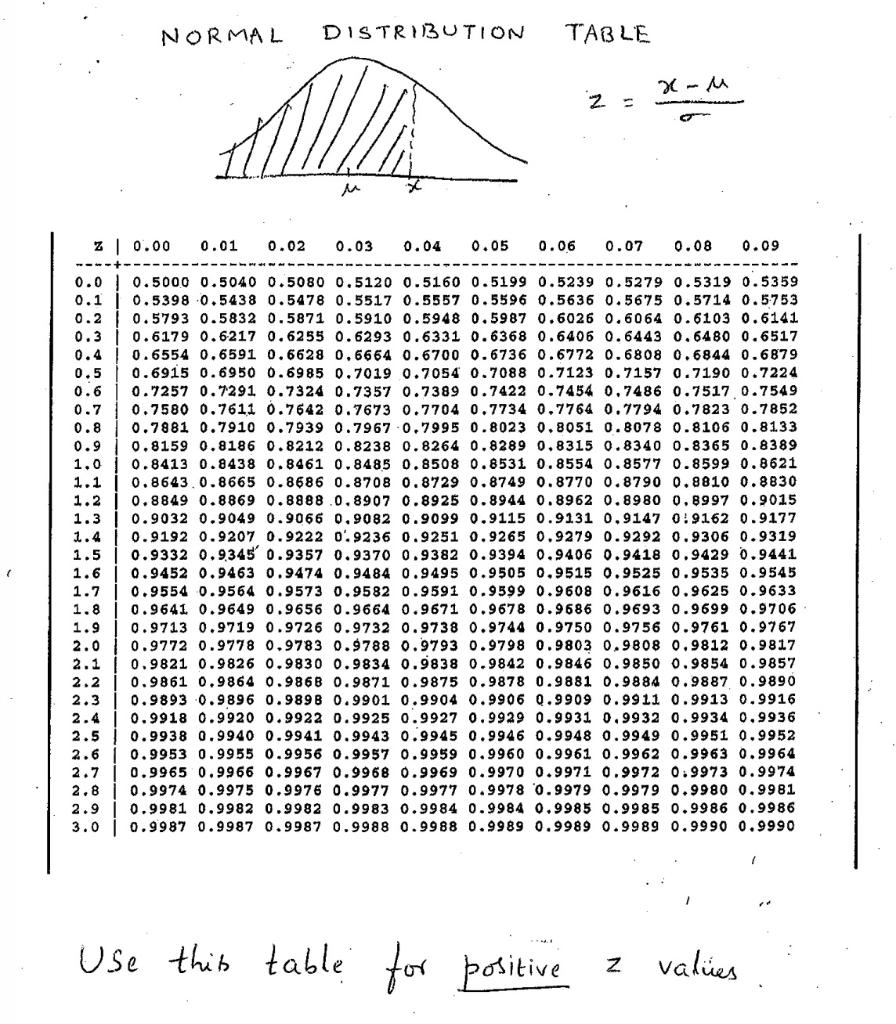
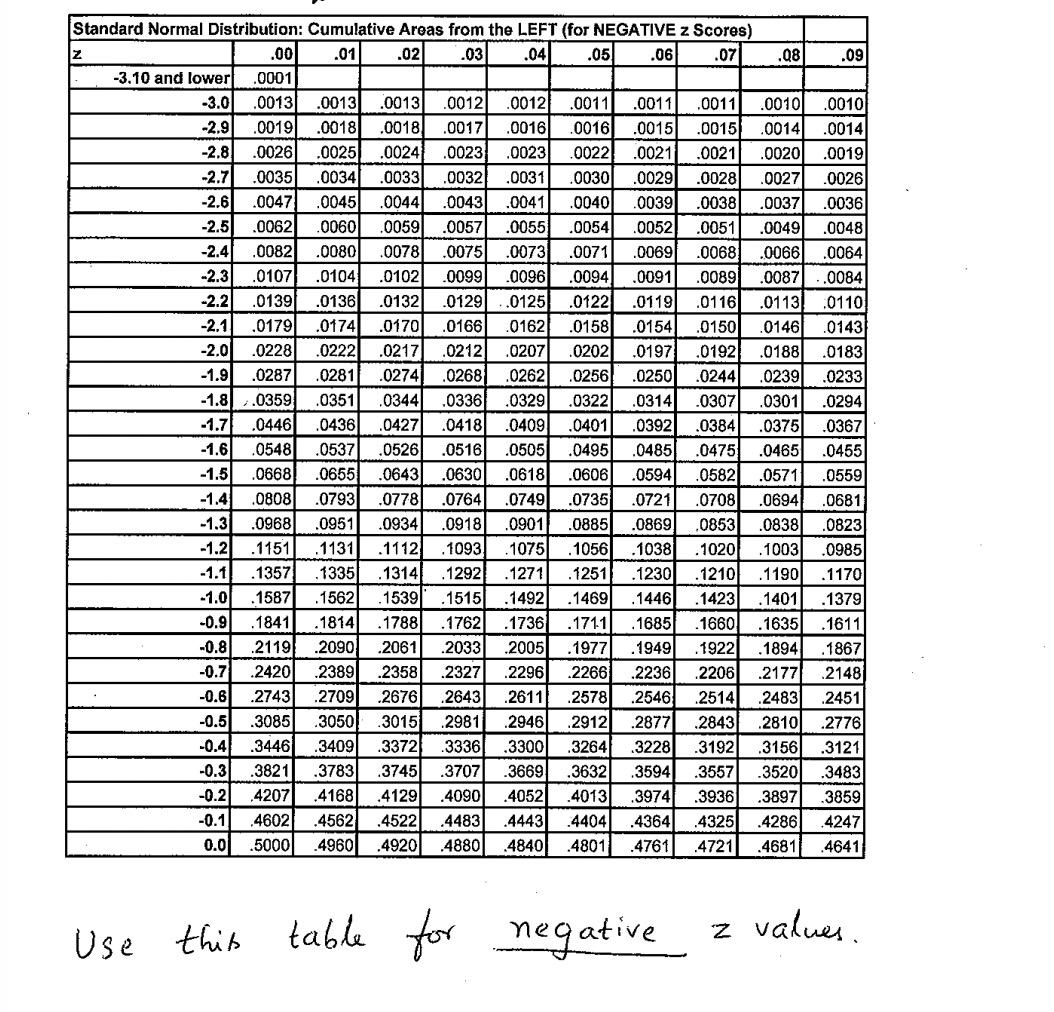
The (GRE) and the (MAT) are tests that graduate schools use to evaluate applicants. GRE scores are normally distributed with m = 1500 and s = 300, while MAT scores are normally distributed with m = 50 and s = 5. You decide to take both tests. You score 1875 on the GRE and a 57 on the MAT. On which test did you score better (in terms of percentile)?

Problem 1 (This is based on Week 1 videos) TheProblem 1 (This is based on Week 1 videos) The

NORMAL DISTRIBUTION TABLE Nu 2 M Z 0.00 0.01 0.02 0.03 0.04 0.05 0.06 0.07 0.08 0.09 0.0 0.5000 0.5040 0.5080 0.5120 0.5160 0.5199 0.5239 0.5279 0.5319 0.5359 0.1 0.5398 0.5438 0.5478 0.5517 0.5557 0.5596 0.5636 0.5675 0.5714 0.5753 0.2 0.5793 0.5832 0.5871 0.5910 0.5948 0.5987 0.6026 0.6064 0.6103 0.6141 0.3 0.6179 0.6217 0.6255 0.6293 0.6331 0.6368 0.6406 0.6443 0.6480 0.6517 0.4 0.6554 0.6591 0.6628 0.6664 0.6700 0.6736 0.6772 0.6808 0.6844 0.6879 0.5 0.6915 0.6950 0.6985 0.7019 0.7054 0.7088 0.7123 0.7157 0.7190 0.7224 0.6 0.7257 0.7291 0.7324 0.7357 0.7389 0.7422 0.7454 0,7486 0.7517 0.7549 0.7 0.7580 0.7611 0.7642 0.7673 0.7704 0.7734 0.7764 0.7794 0.7823 0.7852 0.8 0.7881 0.7910 0.7939 0.7967 -0.7995 0.8023 0.8051 0.8078 0.8106 0.8133 0.9 0.8159 0.8186 0.8212 0.8238 0.8264 0.8289 0.8315 0.8340 0.8365 0.8389 1.0 0.8413 0.8438 0.8461 0.8485 0.8508 0.8531 0.8554 0.8577 0.8599 0.8621 1.1 0.8643.0.8665 0.8686 0.8708 0.8729 0.8749 0.8770 0.8790 0.8810 0.8830 1.2 0.8849 0.8869 0.8888.0.8907 0.8925 0.8944 0.8962 0.8980 0.8997 0.9015 1.3 0.9032 0.9049 0.9066 0.9082 0.9099 0.9115 0.9131 0.9147 0:9162 0.9177 1.4 0.9192 0.9207 0.9222 0.9236 0.9251 0.9265 0.9279 0.9292 0.9306 0.9319 1.5 0.9332 0.9345' 0.9357 0.9370 0.9382 0.9394 0.9406 0.9418 0.9429 0.9441 1.6 0.9452 0.9463 0.9474 0.9484 0.9495 0.9505 0.9515 0.9525 0.9535 0.9545 1.7 0.9554 0.9564 0.9573 0.9582 0.9591 0.9599 0.9608 0.9616 0.9625 0.9633 1.8 0.9641 0.9649 0.9656 0.9664 0.9671 0.9678 0.9686 0.9693 0.9699 0.9706 1.9 0.9713 0.9719 0.9726 0.9732 0.9738 0.9744 0.9750 0.9756 0.9761 0.9767 2.0 0.9772 0.9778 0.9783 0.9788 0.9793 0.9798 0.9803 0.9808 0.9812 0.9817 2.1 0.9821 0.9826 0.9830 0.9834 0.9838 0.9842 0.9846 0.9850 0.9854 0.9857 2.2 0.9861 0.9864 0.9868 0.9871 0.9875 0.9878 0.9881 0.9884 0.9887 0.9890 2.3 0.9893 0.9896 0.9898 0.9901 0.9904 0.9906 0.9909 0.9911 0.9913 0.9916 2.4 0.9918 0.9920 0.9922 0.9925 0.9927 0.9929 0.9931 0.9932 0.9934 0.9936 2.5 0.9938 0.9940 0.9941 0.9943 0.9945 0.9946 0.9948 0.9949 0.9951 0.9952 2.6 0.9953 0.9955 0.9956 0.9957 0.9959 0.9960 0.9961 0.9962 0.9963 0.9964 2.7 0.9965 0.9966 0.9967 0.9968 0.9969 0.9970 0.9971 0.9972 0.9973 0.9974 2.8 0.9974 0.9975 0.9976 0.9977 0.9977 0.9978 0.9979 0.9979 0.9980 0.9981 2.9 0.9981 0.9982 0.9982 0.9983 0.9984 0.9984 0.9985 0.9985 0.9986 0.9986 3.0 0.9987 0.9987 0.9987 0.9988 0.9988 0.9989 0.9989 0.9989 0.9990 0.9990 Use this table for positive N values .09 .0023 .0023 .0029 .0010 .0014 .0019 .0026 .0036 .0048 .0064 .0336 .0401 Standard Normal Distribution: Cumulative Areas from the LEFT (for NEGATIVE Z Scores) Z .00 .01 .02 .03 .04 .05) .06 .07 .08 -3.10 and lower .0001 -3.0 .0013 .0013 .0013 0012 .0012 .0011 .0011 .0011 .0010 -2.9 .0019 .0018 .0018 .0017 .0016 .0016 .0015 .0015 .0014 -2.8 .0026 .0025 .0024 .0022 .0021 .0021 .0020 -2.7 .0035 .0034 .0033 .0032 .0031 .0030 .0028 .0027 -2.6 .0047 .0045 .0044 .0043 .0041 .0040 0039 .0038 .0037 -2.5 .0062 0060 .0059 .0057 .0055 .0054 .0052 .0051 .0049 -2.4 .0082 .0080 .0078 .0075 .0073 .0071 .0069 .0068 .0066 -2.3 .0107 .0104 .0102 .0099 .0096 .0094 .0091 .0089 .0087 -2.2 .0139 .0136 .0132 .0129 .0125 0122 .0119 .0116 .0113 -2.1 .0179 .0174 .0170 .0166 .0162 .0158 .0154 .0150 .0146 -2.0 .0228 .0222 .0217 .0212 .0207 .0202 .0197 .0192 .0188 -1.9 .0287 .0281 .0274 .0268 .0262 .0256 .0250 0244 0239 -1.8 .0359 .0351 .0344 .0329 .0322 0314 .0307 .0301 -1.7 .0446 .0436 .0427 .0418 .0409 .0392 .0384 .0375 -1.6 .0548 .0537 .0526 .0516 .0505 .0495 .0485 .0475 .0465 -1.5 .0668 .0655 .0643 .0630 .0618 .0606 .0594 .0582 .0571 -1.4 .0808 .0793 .0778 .0764 .0749 .0735 .0721 .0708 .0694 -1.3 .0968 .0951 .0934 .0918 .0901 .0885 .0869 ,0853 .0838 -1.2 .1151 1131 .1112 .1093 1075 .1056 .1038 . 1020 .1003 -1.1 .1357 .1335 .1314 . 1292 .1271 .1251 .1230 . 1210 .1190 - 1.0 .1587 . 1562 . 1539 .1515 . 1492 .1469 .1446 .1423 .1401 -0.9 .1841 .1814 .1788 .1762 .1736 .1711 .1685 1660 .1635 -0.8 .2119 .2090 .2061 .2033 .2005 .1977 .1949 1922 .1894 -0.7 2420 2389 .2358 .2327 .2296 .2266 .2236 2206 .2177 -0.6 .2743 .2709 2676 .2643 2611 2578 .2546 2514 2483 -0.5 .3085 3050 3015 .2981 .2946 2912 .2877 2843 2810 -0.4 .3446 .3409 .3372 .3336 .3300 .3264 3228 .3192 3156 -0.3 .3821 .3783 .3745 3707 .3669 .3632 .3594 .3557 .3520 -0.2 4207 .4168 .4129 4090 .4052 .4013 .3974 .3936 .3897 -0.1 4602 4562 4522 4483 .4443 .4364 4325 .4286 0.0 .5000 .4960 .4920 .4880 4840 4801 4761 .4721 .4681 .0084 0110 .0143 .0183 0233 .0294 .0367 .0455 .0559 .0681 .0823 .0985 .1170 .1379 .1611 . 1867 2148 .2451 .2776 .3121 .3483 3859 4247 .4641 .4404 Use this table for negative z values

Step by Step Solution

There are 3 Steps involved in it

1 Expert Approved Answer
Step: 1 Unlock blur-text-image
Question Has Been Solved by an Expert!

Get step-by-step solutions from verified subject matter experts

Step: 2 Unlock
Step: 3 Unlock

Students Have Also Explored These Related General Management Questions!