

Question: Problem #1 Three different diet plans are to be tested for mean weight loss. The entries in the table shown below are weight losses for
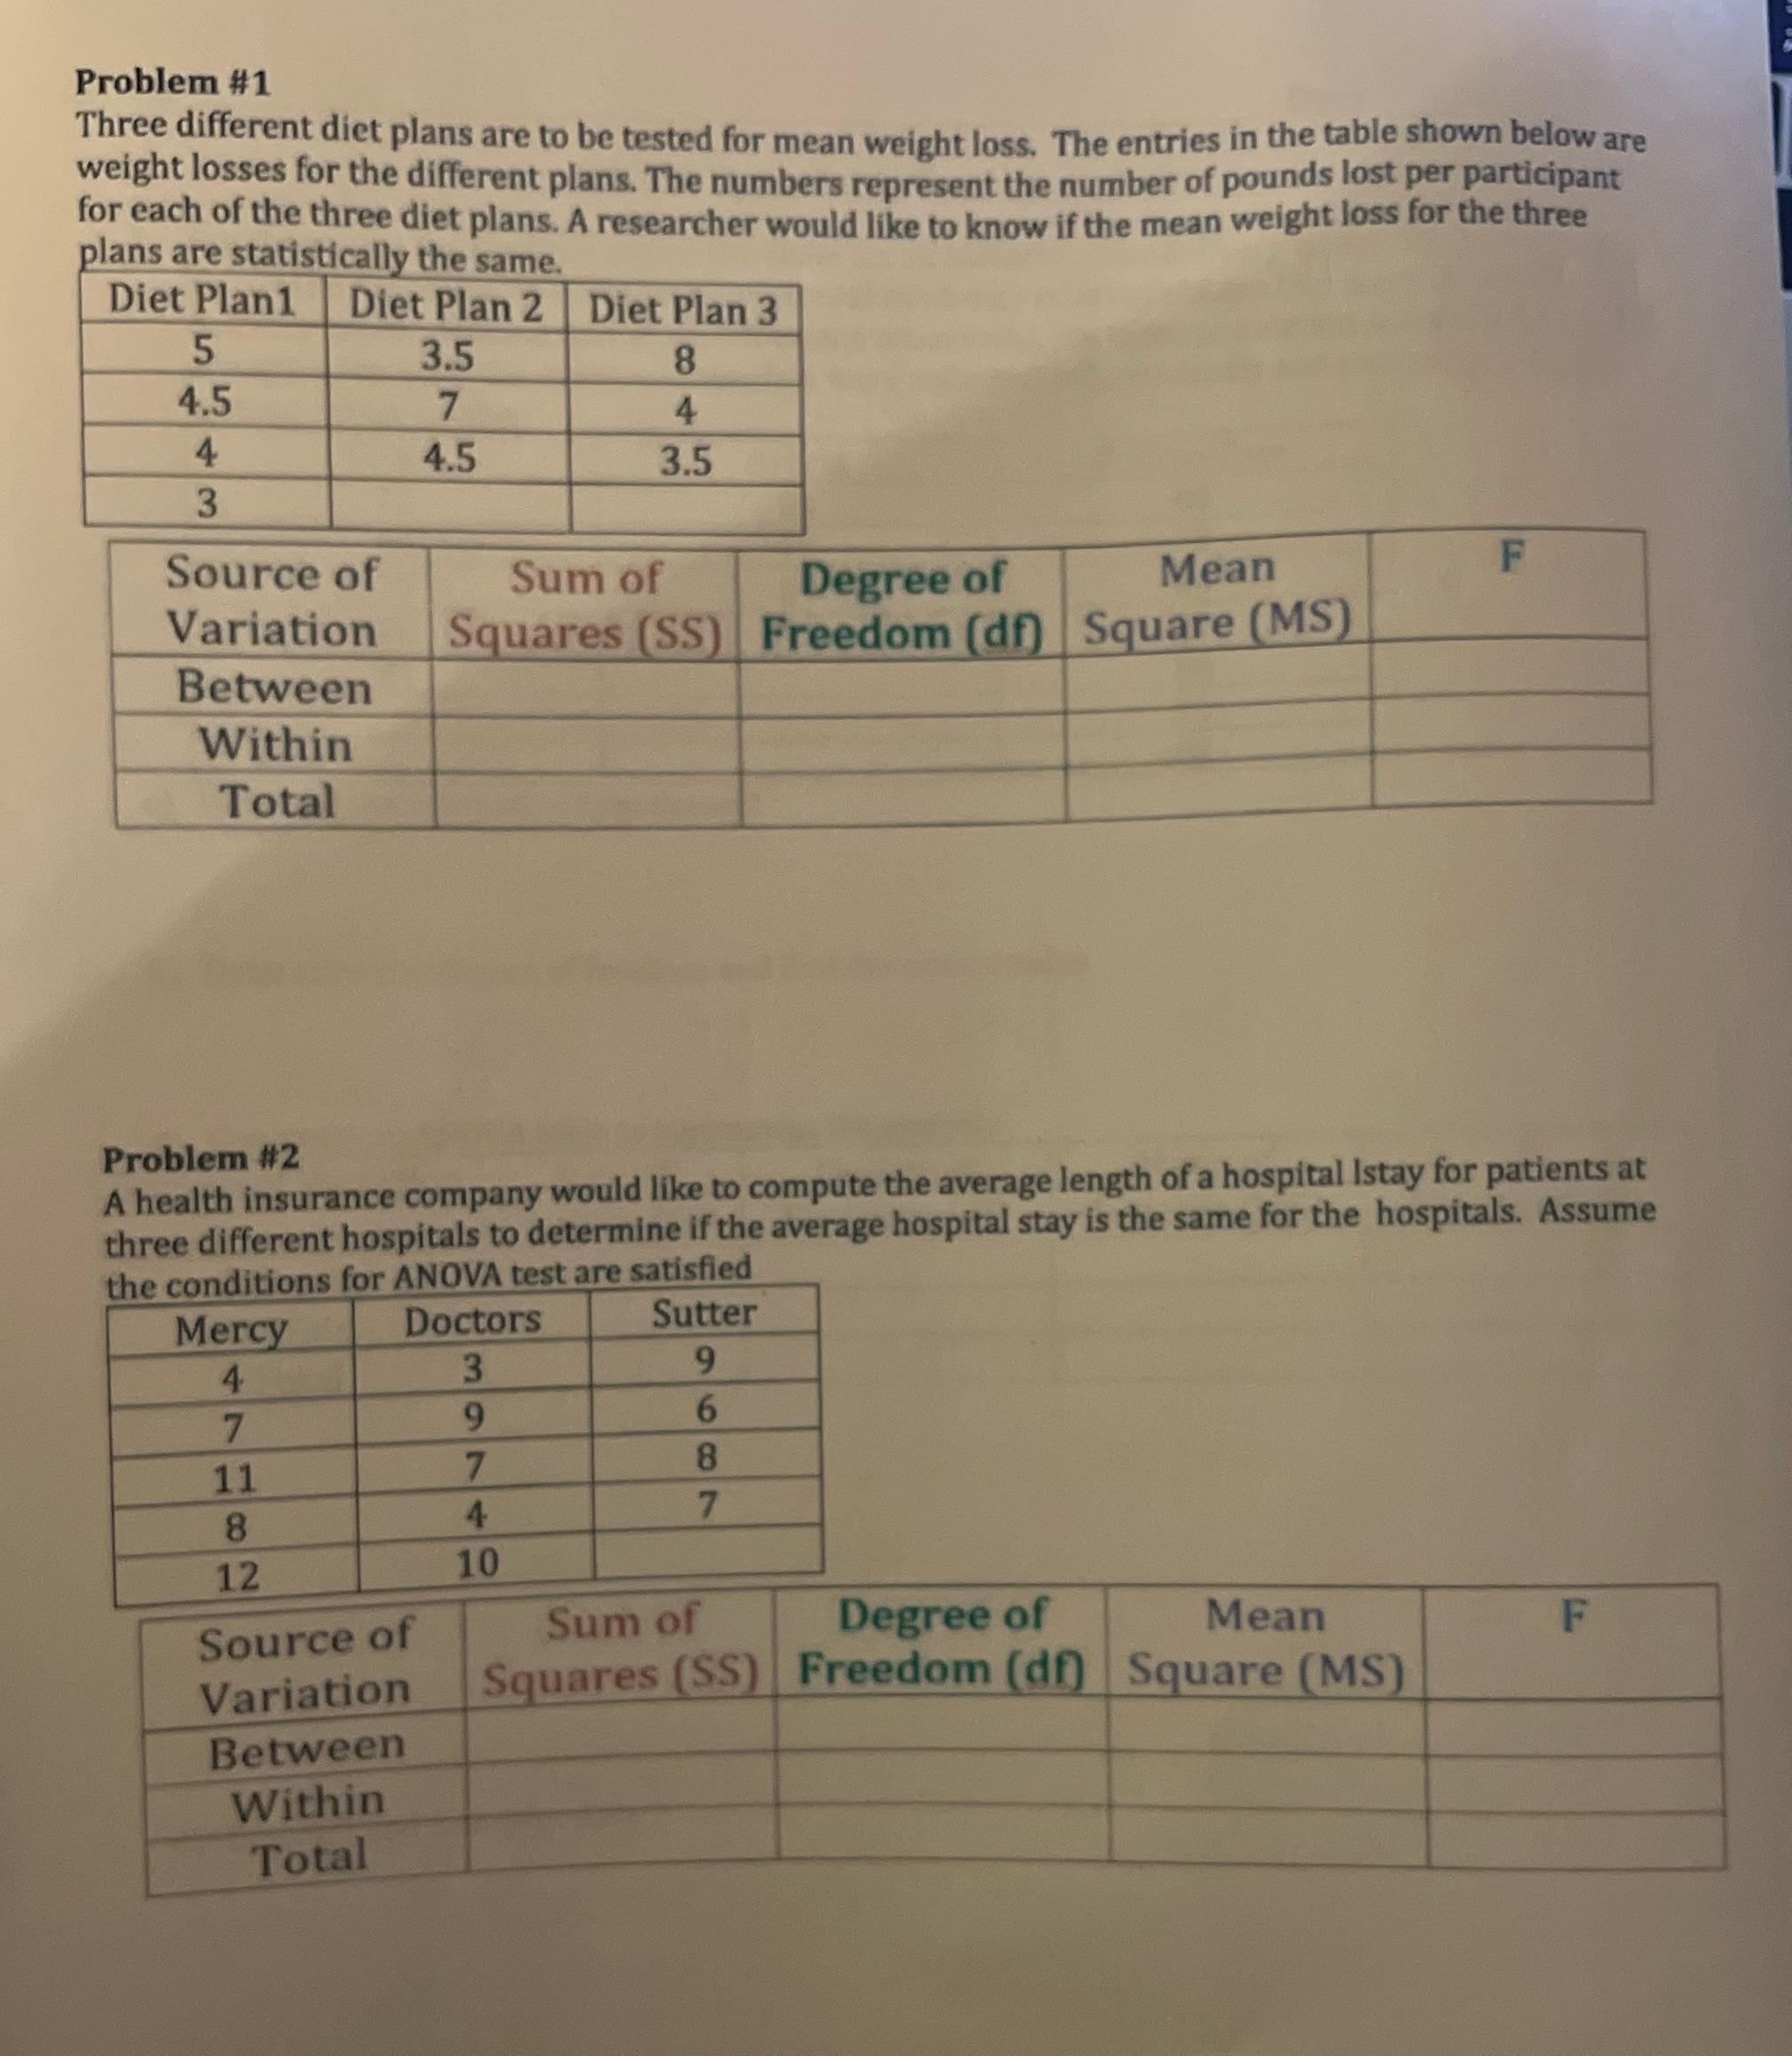
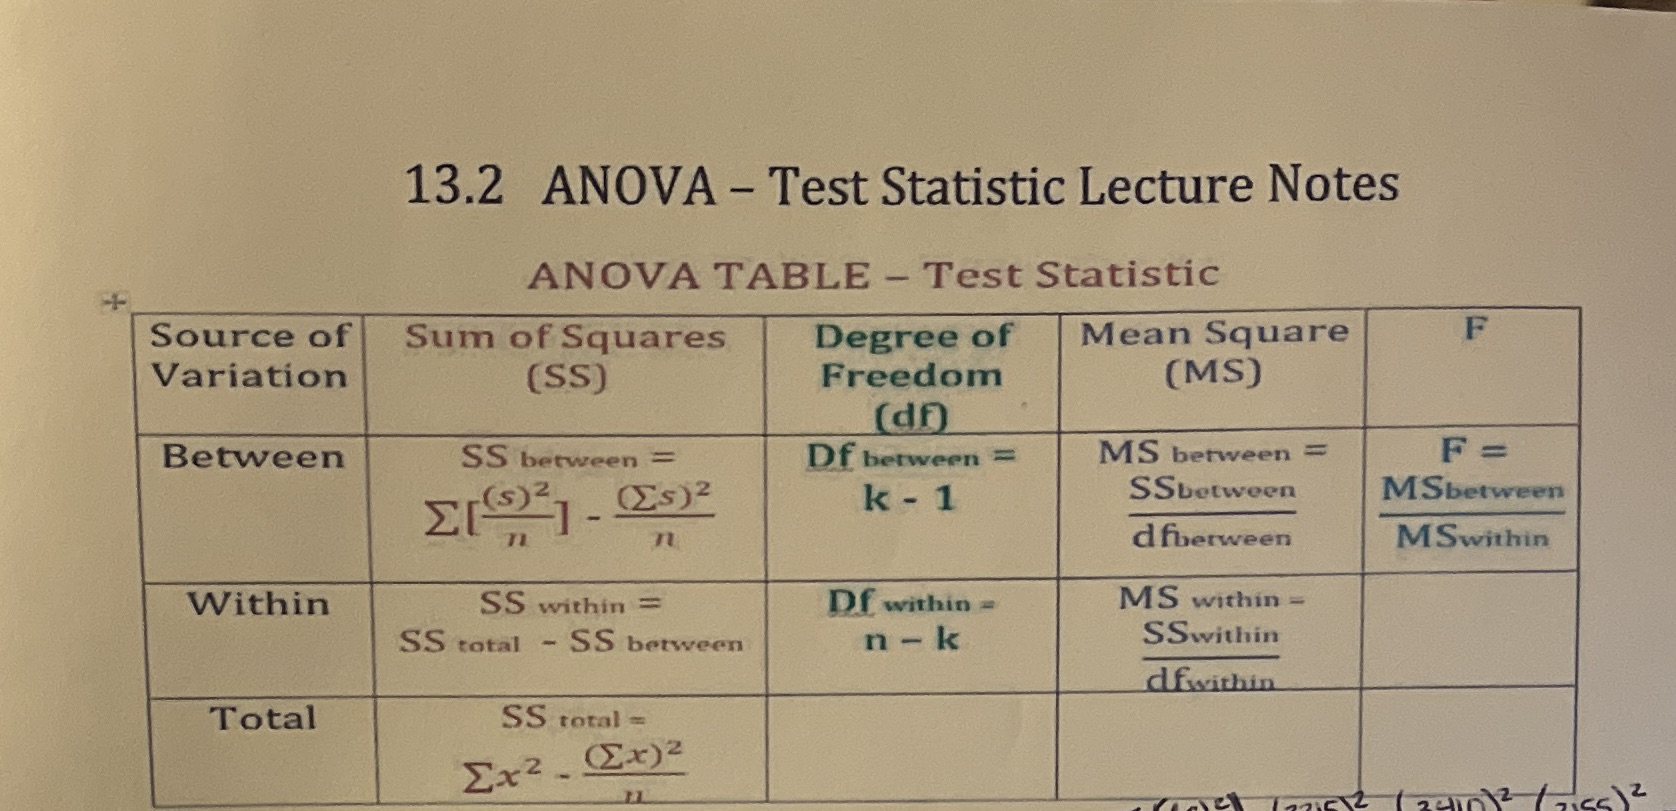
Problem #1 Three different diet plans are to be tested for mean weight loss. The entries in the table shown below are weight losses for the different plans. The numbers represent the number of pounds lost per participant for each of the three diet plans. A researcher would like to know if the mean weight loss for the three plans are statistically the same. Diet Plan1 Diet Plan 2 Diet Plan 3 5 3.5 8 4.5 7 4 4 4.5 3.5 3 Source of Sum of Degree of Mean F Variation Squares (SS) Freedom (df) |Square (MS) Between Within Total Problem #2 A health insurance company would like to compute the average length of a hospital Istay for patients at three different hospitals to determine if the average hospital stay is the same for the hospitals. Assume the conditions for ANOVA test are satisfied Mercy Doctors Sutter 4 3 9 7 9 6 11 7 8 8 4 7 12 10 Source of Sum of Degree of Mean F Variation Squares (SS) Freedom (df) Square (MS) Between Within Total13.2 ANOVA - Test Statistic Lecture Notes ANOVA TABLE - Test Statistic Source of Sum of Squares Degree of Mean Square F Variation (SS) Freedom (MS) (df) Between SS between = Of between = MS between = F = k - 1 SSbetween MSbetween n d fbetween MSwithin Within SS within = Df within = MS within = SS total - SS between n - k SSwithin dfwithin Total SS total = Ex2 _ [x) 2 2
Step by Step Solution
There are 3 Steps involved in it

Get step-by-step solutions from verified subject matter experts