

Question: Problem 1 Upperclassmen with GPAs greater than 3.5 at Some High School (SHS) were surveyed on their knowledge and understanding of the college application process.
Problem 1
Upperclassmen with GPAs greater than 3.5 at Some High School (SHS) were surveyed on their knowledge and understanding of the college application process. The survey scale ranged from 0 (low knowledge) to 50 (high knowledge). Researchers wanted to see if there were differences based on parental income. Below are ANOVA output from a comparison of three income levels (low, medium, high):
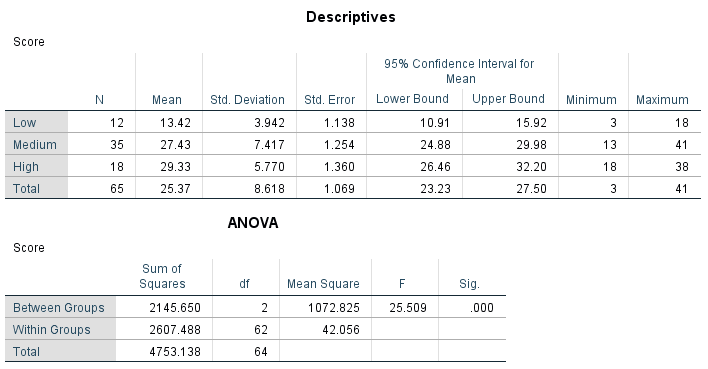
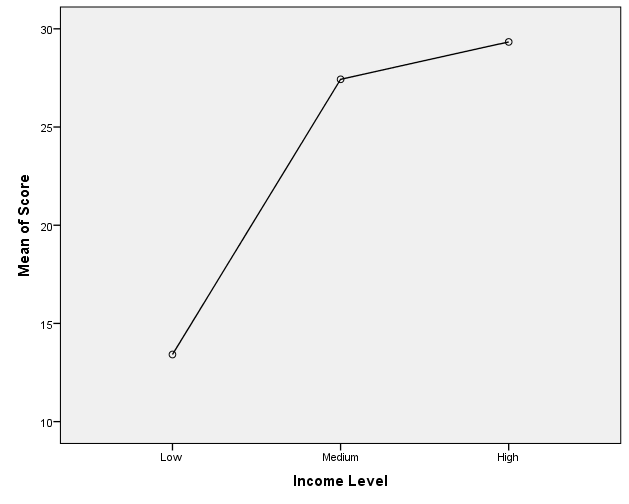
Descriptives Score 95% Confidence Interval for Mean N Mean Std. Deviation Std. Error Lower Bound Upper Bound Minimum Maximum Low 12 13.42 3.942 1.138 10.91 15.92 3 18 Medium 35 27.43 7.417 1.254 24.88 29.98 13 41 High 18 29.33 5.770 1.360 26.46 32.20 18 38 Total 65 25.37 8.618 1.069 23.23 27.50 3 41 ANOVA Score Sum of Squares df Mean Square F Sig. Between Groups 2145.650 2 1072.825 25.509 000 Within Groups 2607.488 62 42.056 Total 4753.138 64
Step by Step Solution
There are 3 Steps involved in it

Get step-by-step solutions from verified subject matter experts