

Question: Problem 1: US Real GDP The reference mode of the US GDP is shown in Figure 1 US Real GDP 8000 AveragrowtRat8.45%/year DoublingTime 20years 4000
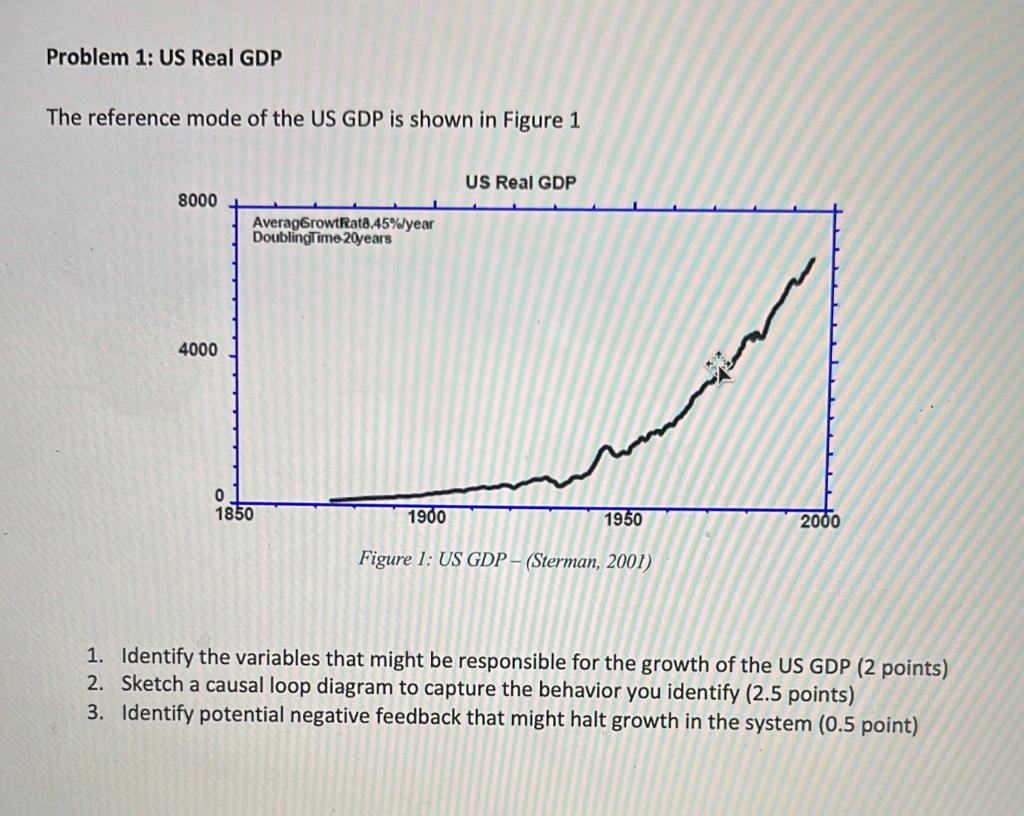
Problem 1: US Real GDP The reference mode of the US GDP is shown in Figure 1 US Real GDP 8000 AveragrowtRat8.45%/year DoublingTime 20years 4000 0 1850 1900 1950 2000 Figure 1: US GDP - (Sterman, 2001) 1. Identify the variables that might be responsible for the growth of the US GDP (2 points) 2. Sketch a causal loop diagram to capture the behavior you identify (2.5 points) 3. Identify potential negative feedback that might halt growth in the system (0.5 point)
Step by Step Solution
There are 3 Steps involved in it
1 Expert Approved Answer
Step: 1 Unlock

Question Has Been Solved by an Expert!
Get step-by-step solutions from verified subject matter experts
Step: 2 Unlock
Step: 3 Unlock