

Question: Problem 1 : Use following data for a 6 0 min storm, what is the total depth of rainfall for the storm? What is the
Problem : Use following data for a min storm, what is the total depth of rainfall for the storm? What is the maximum and minimum intensity and graph storm Hyetograph, with ordinates in marks
tableStorm timemintableRasinfall depthmm
Problem : Use the same data as given above and graph storm Hyetograph for a mins, mins and mins time scale. marks
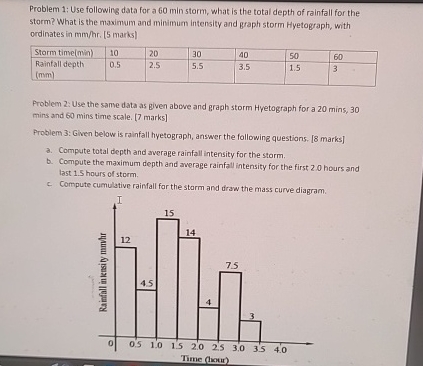
Problem : Given below is rainfall hyetograph, answer the following questions. marks
a Compute total depth and average rainfall intensity for the storm.
b Compute the maximum depth and average rainfall intensity for the first hours and last hours of storm.
c Compute cumulative raimall for the storm and draw the mass curve diagram.
Step by Step Solution
There are 3 Steps involved in it
1 Expert Approved Answer
Step: 1 Unlock

Question Has Been Solved by an Expert!
Get step-by-step solutions from verified subject matter experts
Step: 2 Unlock
Step: 3 Unlock