

Question: Problem 1 Use the incident trees attached to compare the before and after studies and conduct appropriate statistical tests (e.g., t-test, z-test...etc) to answer
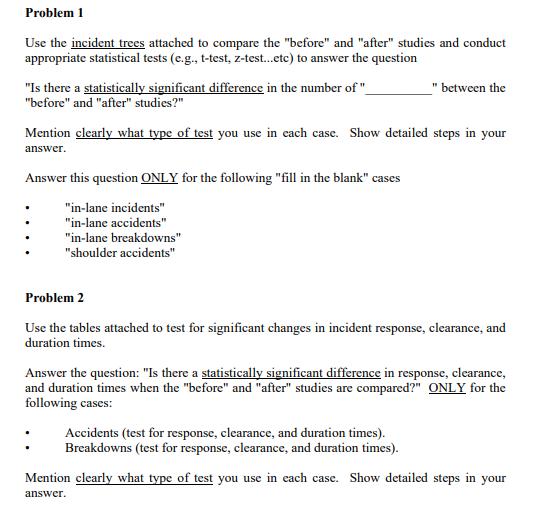
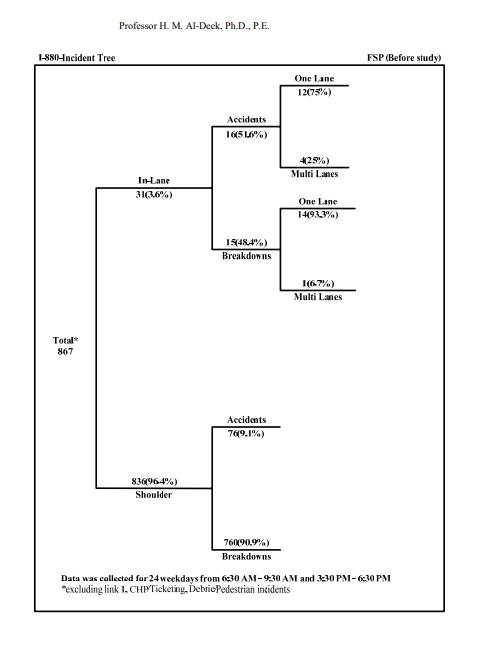
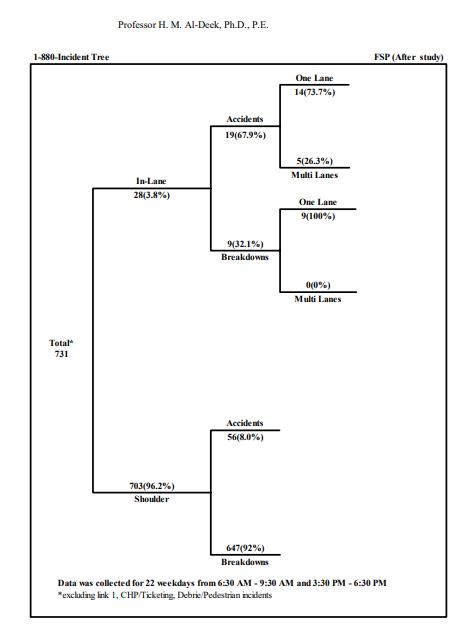
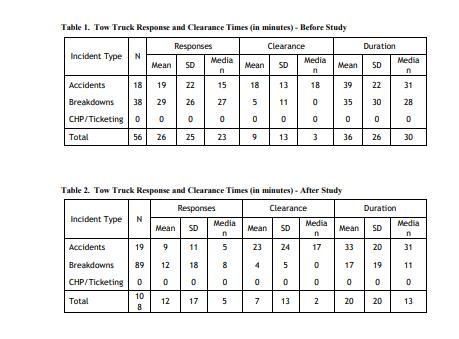
Problem 1 Use the incident trees attached to compare the "before" and "after" studies and conduct appropriate statistical tests (e.g., t-test, z-test...etc) to answer the question "Is there a statistically significant difference in the number of " "before" and "after" studies?" Mention clearly what type of test you use in each case. Show detailed steps in your answer. Answer this question ONLY for the following "fill in the blank" cases "in-lane incidents" "in-lane accidents" "in-lane breakdowns" "shoulder accidents" "between the Problem 2 Use the tables attached to test for significant changes in incident response, clearance, and duration times. Answer the question: "Is there a statistically significant difference in response, clearance, and duration times when the "before" and "after" studies are compared?" ONLY for the following cases: Accidents (test for response, clearance, and duration times). Breakdowns (test for response, clearance, and duration times). Mention clearly what type of test you use in each case. Show detailed steps in your answer. 1-880-Incident Tree Total 867 Professor H. M. Al-Deck, Ph.D., P.E. In-Lane 31(3.6%) 836(964%) Shoulder Accidents 16(516%) 15(48,4%) Breakdowns Accidents 76(9.1%) 760(90.9%) Breakdowns One Lane 12(75%) 4(25%) Multi Lanes One Lane. 14(93,3%) 1(6.7%) Multi Lanes FSP (Before study) Data was collected for 24 weekdays from 6:30 AM-9:30 AM and 3:30 PM-6:30 PM "excluding link 1, CHP/Ticketing, DebriePedestrian incidents 1-880-Incident Tree Total 731 Professor H. M. Al-Deck, Ph.D., P.E. In-Lane 28(3.8%) 703(96.2%) Shoulder Accidents 19(67.9%) 9(32.1%) Breakdowns Accidents 56(8.0%) 647(92%) Breakdowns One Lane 14(73.7%) 5(26.3%) Multi Lanes One Lane 9(100%) 0(0%) Multi Lanes FSP (After study) Data was collected for 22 weekdays from 6:30 AM - 9:30 AM and 3:30 PM - 6:30 PM *excluding link 1, CHP/Ticketing, Debrie/Pedestrian incidents Table 1. Tow Truck Response and Clearance Times (in minutes) - Before Study Clearance Incident Type N Mean Accidents 18 19 22 Breakdowns 38 29 26 CHP/Ticketing 0 0 0 56 26 25 Total Incident Type N Responses SD Mean Accidents 19 9 Breakdowns 89 12 CHP/Ticketing 0 0 10 12 8 Total Media 17 15 27 0 23 Table 2. Tow Truck Response and Clearance Times (in minutes) - After Study Responses Clearance SD SD 11 18 0 Media n 5 00 8 0 Mean SD 13 11 0 13 5 18 5 0 9 Mean 23 24 4 5 0 0 13 Media n 18 0 0 3 7 Mean Media n 17 0 0 2 39 35 0 36 Mean 33 17 0 20 Duration SD Media n 22 31 30 28 0 0 30 26 Duration SD 20 19 0 20 Media n 31 11 0 13
Step by Step Solution
3.42 Rating (149 Votes )
There are 3 Steps involved in it
Answer 1 Inlane Accidents For this case we can use a twotailed ttest to compare the mean number of incidents before and after the study The twotailed ttest will be used to measure the difference betwe... View full answer

Get step-by-step solutions from verified subject matter experts