Question: Problem 1 Use the worksheet Vehicles for this problem. You will help a facilities department for a university analyze their vehicle data for decision support.
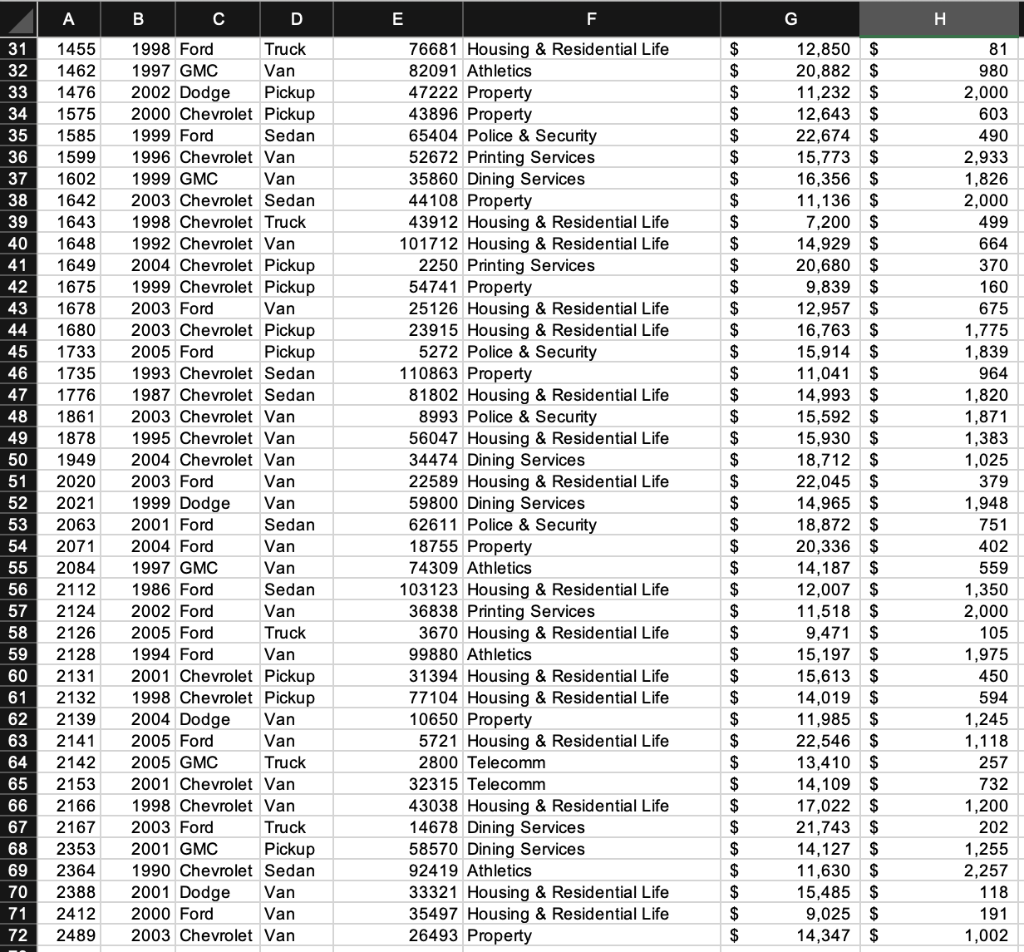
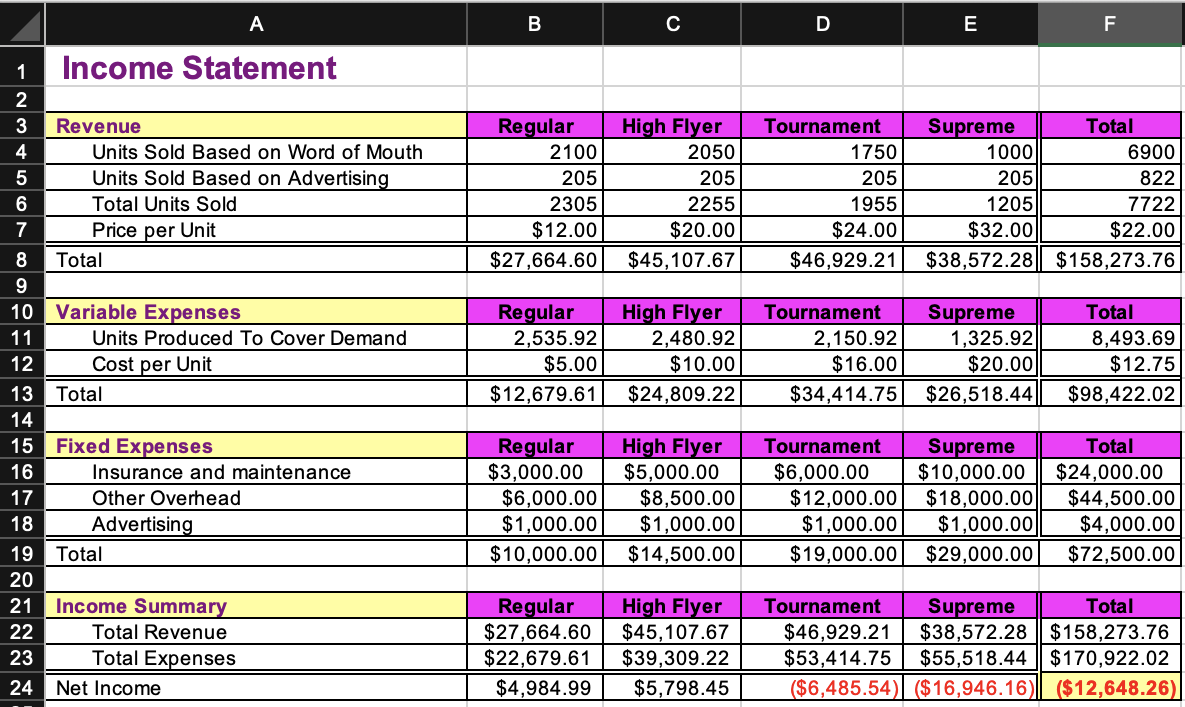
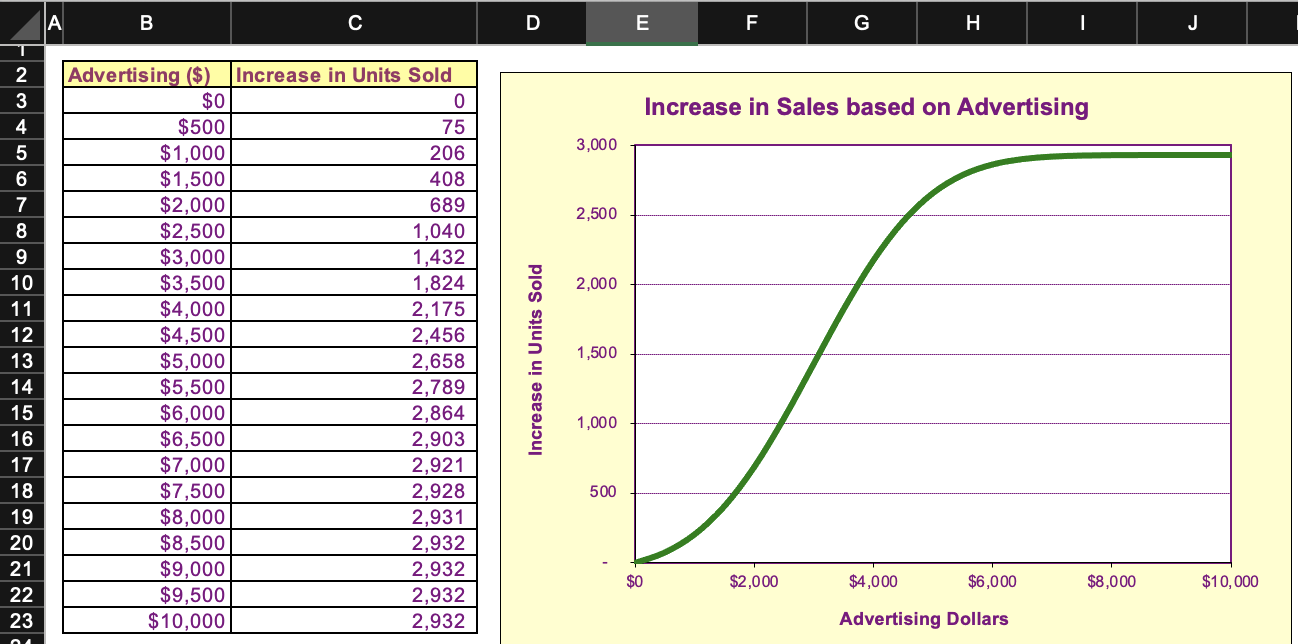
Problem 1 Use the worksheet Vehicles for this problem. You will help a facilities department for a university analyze their vehicle data for decision support. Answer the following questions based on your analysis of the data. 1. The sales manager would like to know the total maintenance costs according to each make, type and year of vehicles. a. Which combination of the three parameters (i.e., make, type, and year) has the highest total maintenance cost and what is that cost? b. Which combination has the lowest total maintenance cost and what is that cost? 2. Which department has the highest number of vehicles assigned? In this department, what type of vehicle is found the most and how many? 3. What is the average price of the Ford Trucks in the Housing & Residential Life department? 4. Which vehicle (make/type/year) has the highest odometer reading? a. What is the vehicle make/type/year? b. What is the odometer reading? C. What department this vehicle assigned to? Problem 2 Use the worksheets Disks and Advertising Model for this problem. Disks, Inc. sells several types of professional Frisbee disks. Mike Smith, the general manager of the company has created an Income statement, based on the various data he has, in the worksheet named Disks. The Advertising Model worksheet shows how many units of the disks can be sold for different levels of advertising. Using Excel DSS capabilities, help Mike answer the following questions. 1. Mike Smith wants to know how the Insurance & Maintenance (I&M) expenses for Regular disks impacts the net income for Regular disks. The I&M expenses can vary between $3500 and $5000 (assume step size of $250) and the price per unit of Regular disks can vary between $12 and $24 (assume step size of $2). Show the net income values for Regular disks under the various combinations of I&M expenses and price per unit as above? a. What is the net income for Regular disks when I&M expense is $4500 and price per unit is $18? b. What Excel feature did you use to answer this question? 2. Mike wants to determine the impact of different advertising approaches and answer the following questions: a. How many units of Tournament disks should be sold by Word of Mouth in order for this disk type to break even? b. What should the Price per Unit be set at in order for the Supreme disks to break even? C. What Excel feature did you use to answer these questions? 3. If any of the cell values had changed by working on problem 2 revert to the original values by clicking Undo. Under the original worksheet values, what should be spent on advertising for each disk type in order to maximize the Net Income for the whole company (i.e., for Disks, Inc.)? The constraints are as follows. The total advertising budget is limited to $15000 and the company wants to spend at least $2000 towards promoting each disk type. But, the company can only make a maximum of 5000 Supreme disks to sell. Mr. Smith also wants none of the individual disk types to make a loss. a. What is the amount spent on advertising for each disk type? b. What is the number of units produced to cover demand for High Flyer disks? c. What is the net income for Tournament disks? d. What is number of units sold based on advertising for Supreme disks? e. What Excel feature did you use to answer these questions? A B C D E G . 1455 1462 1476 1575 1585 1599 1602 1642 1643 1648 1649 1675 1678 1680 1733 1735 1776 1861 1878 1949 2020 2021 2063 2071 2084 81 980 2,000 603 490 2,933 1,826 2,000 499 664 370 160 675 1,775 1,839 964 1,820 31 32 33 34 35 36 37 38 39 40 41 42 43 44 45 46 47 48 49 50 51 52 53 54 55 56 57 58 59 60 61 62 63 64 65 66 67 68 69 70 71 72 1,871 1,383 1998 Ford Truck 1997 GMC Van 2002 Dodge Pickup 2000 Chevrolet Pickup 1999 Ford Sedan 1996 Chevrolet Van 1999 GMC Van 2003 Chevrolet Sedan 1998 Chevrolet Truck 1992 Chevrolet Van 2004 Chevrolet Pickup 1999 Chevrolet Pickup 2003 Ford Van 2003 Chevrolet Pickup 2005 Ford Pickup 1993 Chevrolet Sedan 1987 Chevrolet Sedan 2003 Chevrolet Van 1995 Chevrolet Van 2004 Chevrolet Van 2003 Ford Van 1999 Dodge Van 2001 Ford Sedan 2004 Ford Van 1997 GMC Van 1986 Ford Sedan 2002 Ford Van 2005 Ford Truck 1994 Ford Van 2001 Chevrolet Pickup 1998 Chevrolet Pickup 2004 Dodge Van 2005 Ford 2005 GMC Truck 2001 Chevrolet Van 1998 Chevrolet Van 2003 Ford Truck 2001 GMC Pickup 1990 Chevrolet Sedan 2001 Dodge Van 2000 Ford Van 2003 Chevrolet Van 76681 Housing & Residential Life 82091 Athletics 47222 Property 43896 Property 65404 Police & Security 52672 Printing Services 35860 Dining Services 44108 Property 43912 Housing & Residential Life 101712 Housing & Residential Life 2250 Printing Services 54741 Property 25126 Housing & Residential Life 23915 Housing & Residential Life 5272 Police & Security 110863 Property 81802 Housing & Residential Life 8993 Police & Security 56047 Housing & Residential Life 34474 Dining Services 22589 Housing & Residential Life 59800 Dining Services 62611 Police & Security 18755 Property 74309 Athletics 103123 Housing & Residential Life 36838 Printing Services 3670 Housing & Residential Life 99880 Athletics 31394 Housing & Residential Life 77104 Housing & Residential Life 10650 Property 5721 Housing & Residential Life 2800 Telecomm 32315 Telecomm 43038 Housing & Residential Life 14678 Dining Services 58570 Dining Services 92419 Athletics 33321 Housing & Residential Life 35497 Housing & Residential Life 26493 Property $ $ $ $ $ $ $ $ $ $ $ $ $ $ $ $ $ $ $ $ $ $ $ $ $ $ $ $ $ $ $ $ $ $ $ $ $ $ $ $ $ $ 12,850 $ 20,882 $ 11,232 $ 12,643 $ 22,674 $ 15,773 $ 16,356 $ 11,136 $ 7,200 $ 14,929 $ 20,680 $ 9,839 $ 12,957 $ 16,763 $ 15,914 $ 11,041 $ 14,993 $ 15,592 $ 15,930 $ 18,712 $ 22,045 $ 14,965 $ 18,872 $ 20,336 $ 14,187 $ 12,007 $ 11,518 $ 9,471 $ 15,197 $ 15,613 $ 14,019 $ 11,985 $ 22,546 $ 13,410 $ 14,109 $ 17,022 $ 21,743 $ 14,127 $ 11,630 $ 15,485 $ 9,025 14,347 $ 2112 1,025 379 1,948 751 402 559 1,350 2,000 105 1,975 450 594 1,245 1,118 257 732 1,200 202 1,255 2,257 118 191 1,002 2124 2126 2128 2131 2132 2139 2141 2142 2153 2166 2167 2353 2364 2388 2412 2489 Van A B D E F Regular 2100 205 2305 $12.00 $27,664.60 High Flyer 2050 205 2255 $20.00 $45,107.67 Tournament 1750 205 1955 $24.00 $46,929.21 Supreme Total 1000 6900 205 822 1205 7722 $32.00 $22.00 $38,572.28||$ 158,273.76 1 Income Statement 2 3 Revenue 4 Units Sold Based on Word of Mouth 5 Units Sold Based on Advertising 6 Total Units Sold 7 Price per Unit 8 Total 9 10 Variable Expenses 11 Units Produced To Cover Demand 12 Cost per Unit 13 Total 14 15 Fixed Expenses 16 Insurance and maintenance 17 Other Overhead 18 Advertising 19 Total 20 21 Income Summary 22 Total Revenue 23 Total Expenses 24 Net Income Regular 2,535.92 $5.00 $12,679.61 High Flyer 2,480.92 $10.00 $24,809.22 Tournament 2,150.92 $16.00 $34,414.75 Supreme 1,325.92 $20.00 $26,518.44 Total 8,493.69 $12.75 $98,422.02 Regular $3,000.00 $6,000.00 $1,000.00 $10,000.00 High Flyer $5,000.00 $8,500.00 $1,000.00 $14,500.00 Tournament Supreme $6,000.00 $10,000.00 $12,000.00 $18,000.00 $1,000.00 $1,000.00 $19,000.00 $29,000.00 Total $24,000.00 $44,500.00 $4,000.00 $72,500.00 Regular $27,664.60 $22,679.61 $4,984.99 High Flyer $45, 107.67 $39,309.22 $5,798.45 Tournament Supreme Total $46,929.21 $38,572.28 || $ 158,273.76 $53,414.75 $55,518.44 $170,922.02 ($6,485.54)| ($ 16,946.16) ($12,648.26) A B D E F G H I J Increase in Sales based on Advertising 206 3,000 2,500 2,000 2 3 4 5 6 7 8 9 10 11 12 13 14 15 16 17 18 19 20 21 22 23 Advertising ($) Increase in Units Sold $0 0 $500 75 $1,000 $1,500 408 $2,000 689 $2,500 1,040 $3,000 1,432 $3,500 1,824 $4,000 2,175 $4,500 2,456 $5,000 2,658 $5,500 2,789 $6,000 2,864 $6,500 2,903 $7,000 2,921 $7,500 2,928 $8,000 2,931 $8,500 2,932 $9,000 2,932 $9,500 2,932 $10,000 2,932 Units Sold 1,500 Increase 1,000 500 $0 $2,000 $4,000 $6,000 $8,000 $10,000 Advertising Dollars


