

Question: Problem 1 . You have collected data ( shown below ) from travel surveys about the number of recreational trips a household takes in a
Problem You have collected data shown below from travel surveys about the number of recreational
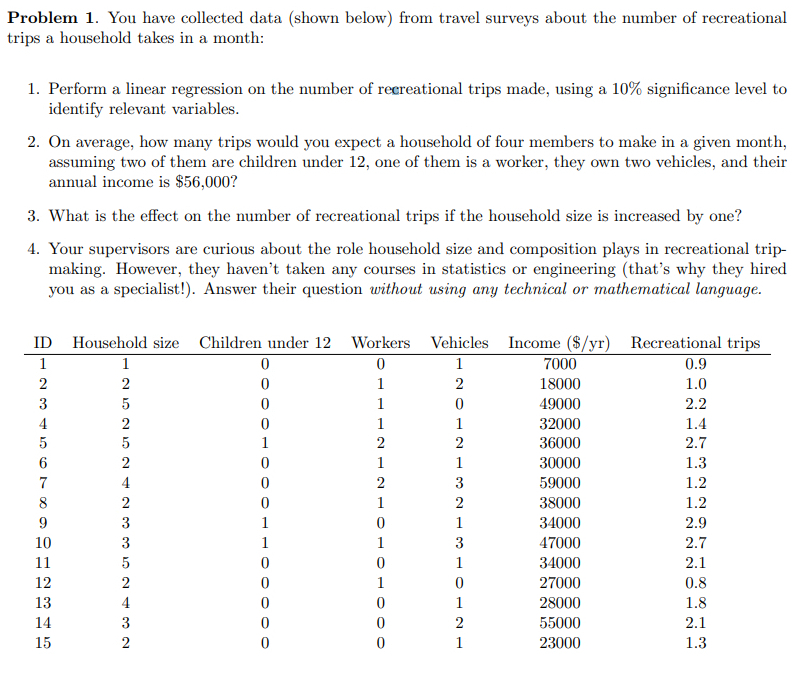
trips a household takes in a month:
Perform a linear regression on the number of recreational trips made, using a significance level to
identify relevant variables.
On average, how many trips would you expect a household of four members to make in a given month,
assuming two of them are children under one of them is a worker, they own two vehicles, and their
annual income is $
What is the effect on the number of recreational trips if the household size is increased by one?
Your supervisors are curious about the role household size and composition plays in recreational trip
making. However, they haven't taken any courses in statistics or engineering thats why they hired
you as a specialist! Answer their question without using any technical or mathematical language.
Step by Step Solution
There are 3 Steps involved in it
1 Expert Approved Answer
Step: 1 Unlock

Question Has Been Solved by an Expert!
Get step-by-step solutions from verified subject matter experts
Step: 2 Unlock
Step: 3 Unlock