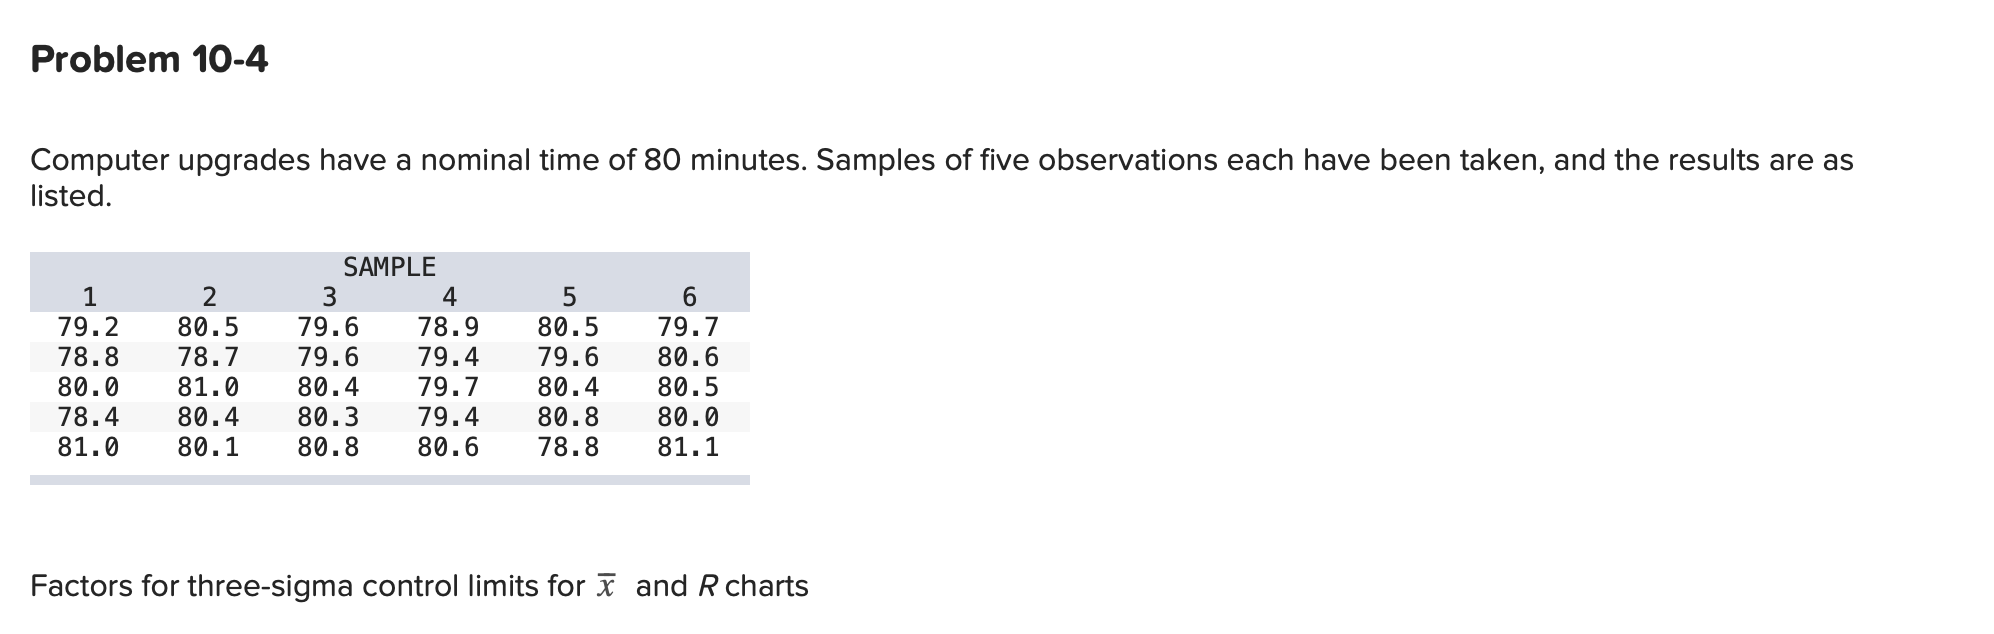
Question: Problem 10-4 Computer upgrades have a nominal time of 80 minutes. Samples of five observations each have been taken, and the results are as listed.

Problem 10-4 Computer upgrades have a nominalProblem 10-4 Computer upgrades have a nominalProblem 10-4 Computer upgrades have a nominal

Problem 10-4 Computer upgrades have a nominal time of 80 minutes. Samples of five observations each have been taken, and the results are as listed. 1 79.2 78.8 80.0 78.4 81.0 2 80.5 78.7 81.0 80.4 80.1 SAMPLE 4 79.6 78.9 79.6 79.4 80.4 79.7 80.3 79.4 80.8 80.6 5 80.5 79.6 80.4 80.8 78.8 6 79.7 80.6 80.5 80.0 81.1 Factors for three-sigma control limits for and R charts Factor for X Chart, A2 Number of Observations in Subgroup, n 2 3 4 5 7 8 9 10 11 12 13 14 15 16 17 18 19 20 1.88 1.02 0.73 0.58 0.48 0.42 0.37 0.34 0.31 0.29 0.27 0.25 0.24 0.22 0.21 0.20 0.19 0.19 0.18 FACTORS FOR R CHARTS Lower Upper Control Control Limit, Limit, D3 D4 0 3.27 0 2.57 0 2.28 0 2.11 2.00 0.08 1.92 0.14 1.86 0.18 1.82 0.22 1.78 0.26 1.74 0.28 1.72 0.31 1.69 0.33 1.67 0.35 1.65 0.36 1.64 0.38 1.62 0.39 1.61 0.40 1.60 0.41 1.59 a. Using factors from above table, determine upper and lower control limits for mean and range charts. (Round your intermediate calculations and final answers to 2 decimal places. Leave no cells blank - be certain to enter "O" wherever required.) Mean Chart Range Chart UCL LCL b. Decide if the process is in control. Yes No

Step by Step Solution

There are 3 Steps involved in it

1 Expert Approved Answer
Step: 1 Unlock blur-text-image
Question Has Been Solved by an Expert!

Get step-by-step solutions from verified subject matter experts

Step: 2 Unlock
Step: 3 Unlock

Students Have Also Explored These Related General Management Questions!