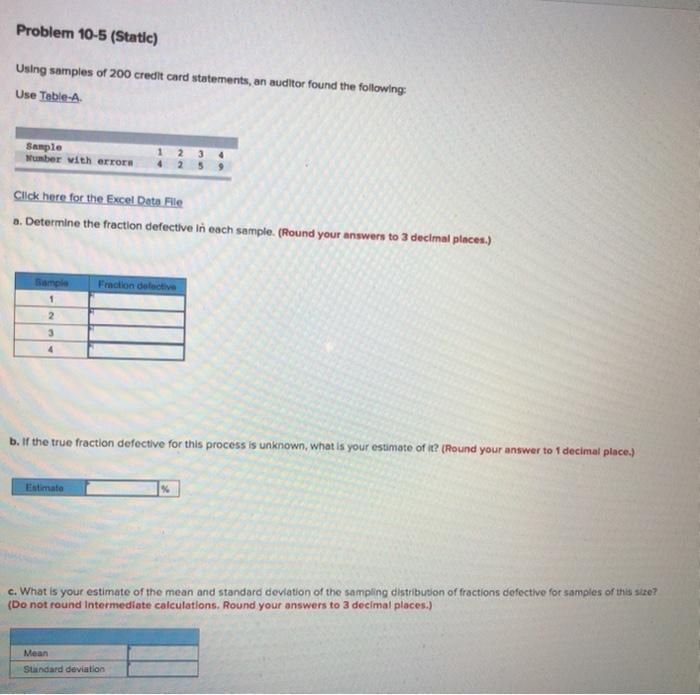
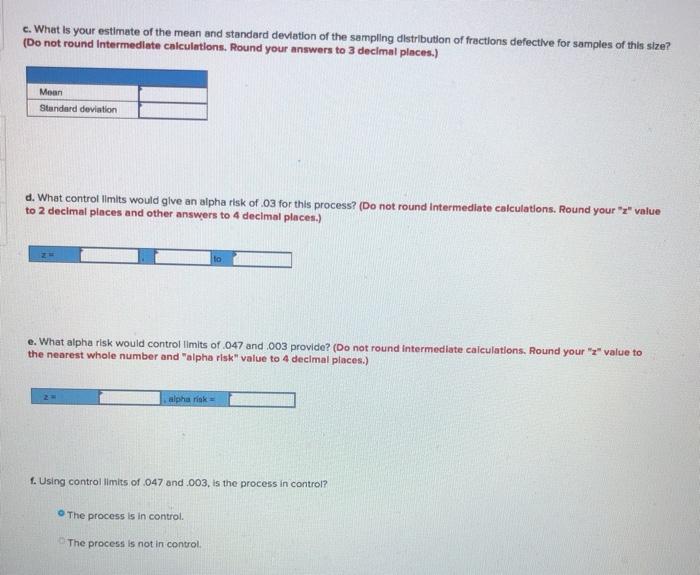
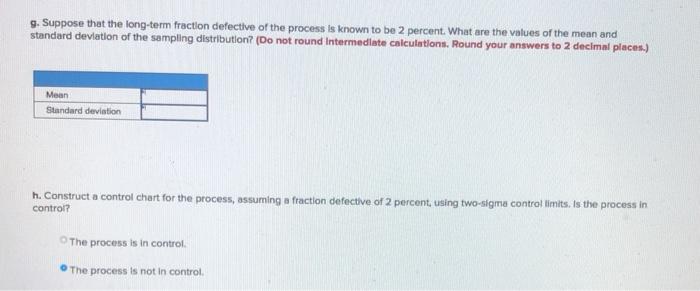
Question: Problem 10-5 (Static) Using samples of 200 credit card statements, an auditor found the following: Use Table A Sample Number with error 1 2 3

Problem 10-5 (Static) Using samples of 200 credit
Problem 10-5 (Static) Using samples of 200 credit card statements, an auditor found the following: Use Table A Sample Number with error 1 2 3 5 4 9 Click here for the Excel Data File a. Determine the fraction defective in each sample. (Round your answers to 3 decimal places.) Sample 1 Fraction detective 2 3 4 b. If the true fraction detective for this process is unknown, what is your estimate of it? (Round your answer to 1 decimal place.) Estimate % c. What is your estimate of the mean and standard deviation of the sampling distribution of fractions defective for samples of this size? (Do not round Intermediate calculations. Round your answers to 3 decimal places.) Mean Standard deviation c. What is your estimate of the mean and standard deviation of the sampling distribution of fractions defective for samples of this size? (Do not round Intermediate calculations, Round your answers to 3 decimal places.) Moon Standard deviation d. What control limits would give an alpha risk of 3 for this process? (Do not round Intermediate calculations. Round your "z" value to 2 decimal places and other answers to 4 decimal places.) lo e. What alpha risk would control limits of 047 and 003 provide? (Do not round intermediate calculations. Round your "z" value to the nearest whole number and alpha risk" value to 4 decimal places.) alpha rak 1. Using control limits of 047 and .003. is the process in control? The process is in control. The process is not in control. 9. Suppose that the long-term fraction defective of the process is known to be 2 percent. What are the values of the mean and standard deviation of the sampling distribution? (Do not round Intermediate calculations. Round your answers to 2 decimal places.) Mean Standard deviation h. Construct a control chart for the process, assuming a fraction defective of 2 percent, using two-sigma controllimits. Is the process in control? The process is in control The process is not in control

Step by Step Solution

There are 3 Steps involved in it

1 Expert Approved Answer
Step: 1 Unlock blur-text-image
Question Has Been Solved by an Expert!

Get step-by-step solutions from verified subject matter experts

Step: 2 Unlock
Step: 3 Unlock

Students Have Also Explored These Related General Management Questions!