

Question: Problem 11-05 (Keyboard Navigable Alternate Version) Use the table and graph to answer three questions. Real GDP (in $ Trillions) Price Level Supplied Demanded 100
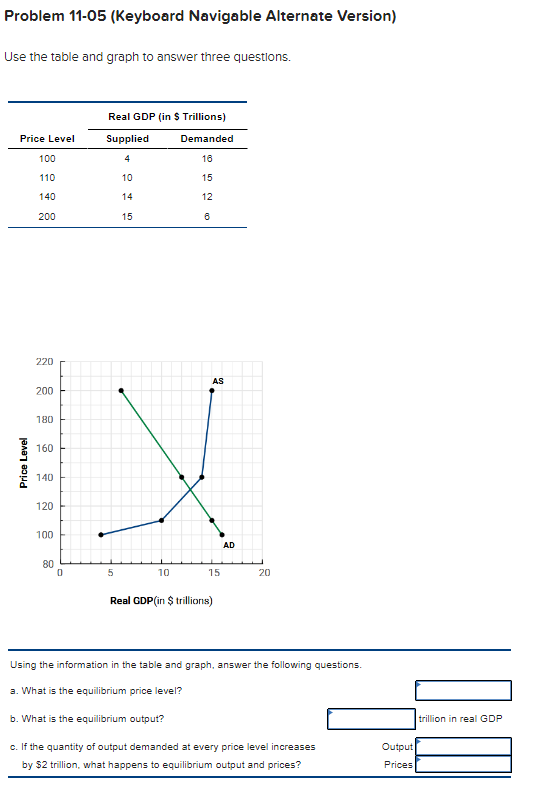

Problem 11-05 (Keyboard Navigable Alternate Version) Use the table and graph to answer three questions. Real GDP (in $ Trillions) Price Level Supplied Demanded 100 16 110 10 15 140 14 12 200 15 220 AS 200 180 160 Price Level 140 120 100 AD 80 5 10 15 20 Real GDP(in $ trillions) Using the information in the table and graph, answer the following questions. a. What is the equilibrium price level? b. What is the equilibrium output? trillion in real GDP c. If the quantity of output demanded at every price level increases Output by $2 trillion, what happens to equilibrium output and prices? Prices
Step by Step Solution
There are 3 Steps involved in it
1 Expert Approved Answer
Step: 1 Unlock

Question Has Been Solved by an Expert!
Get step-by-step solutions from verified subject matter experts
Step: 2 Unlock
Step: 3 Unlock