

Question: Problem 12. (1 point) The graph below shows the position of a car (in miles from Gackle, ND) as a function of time (in minutes).
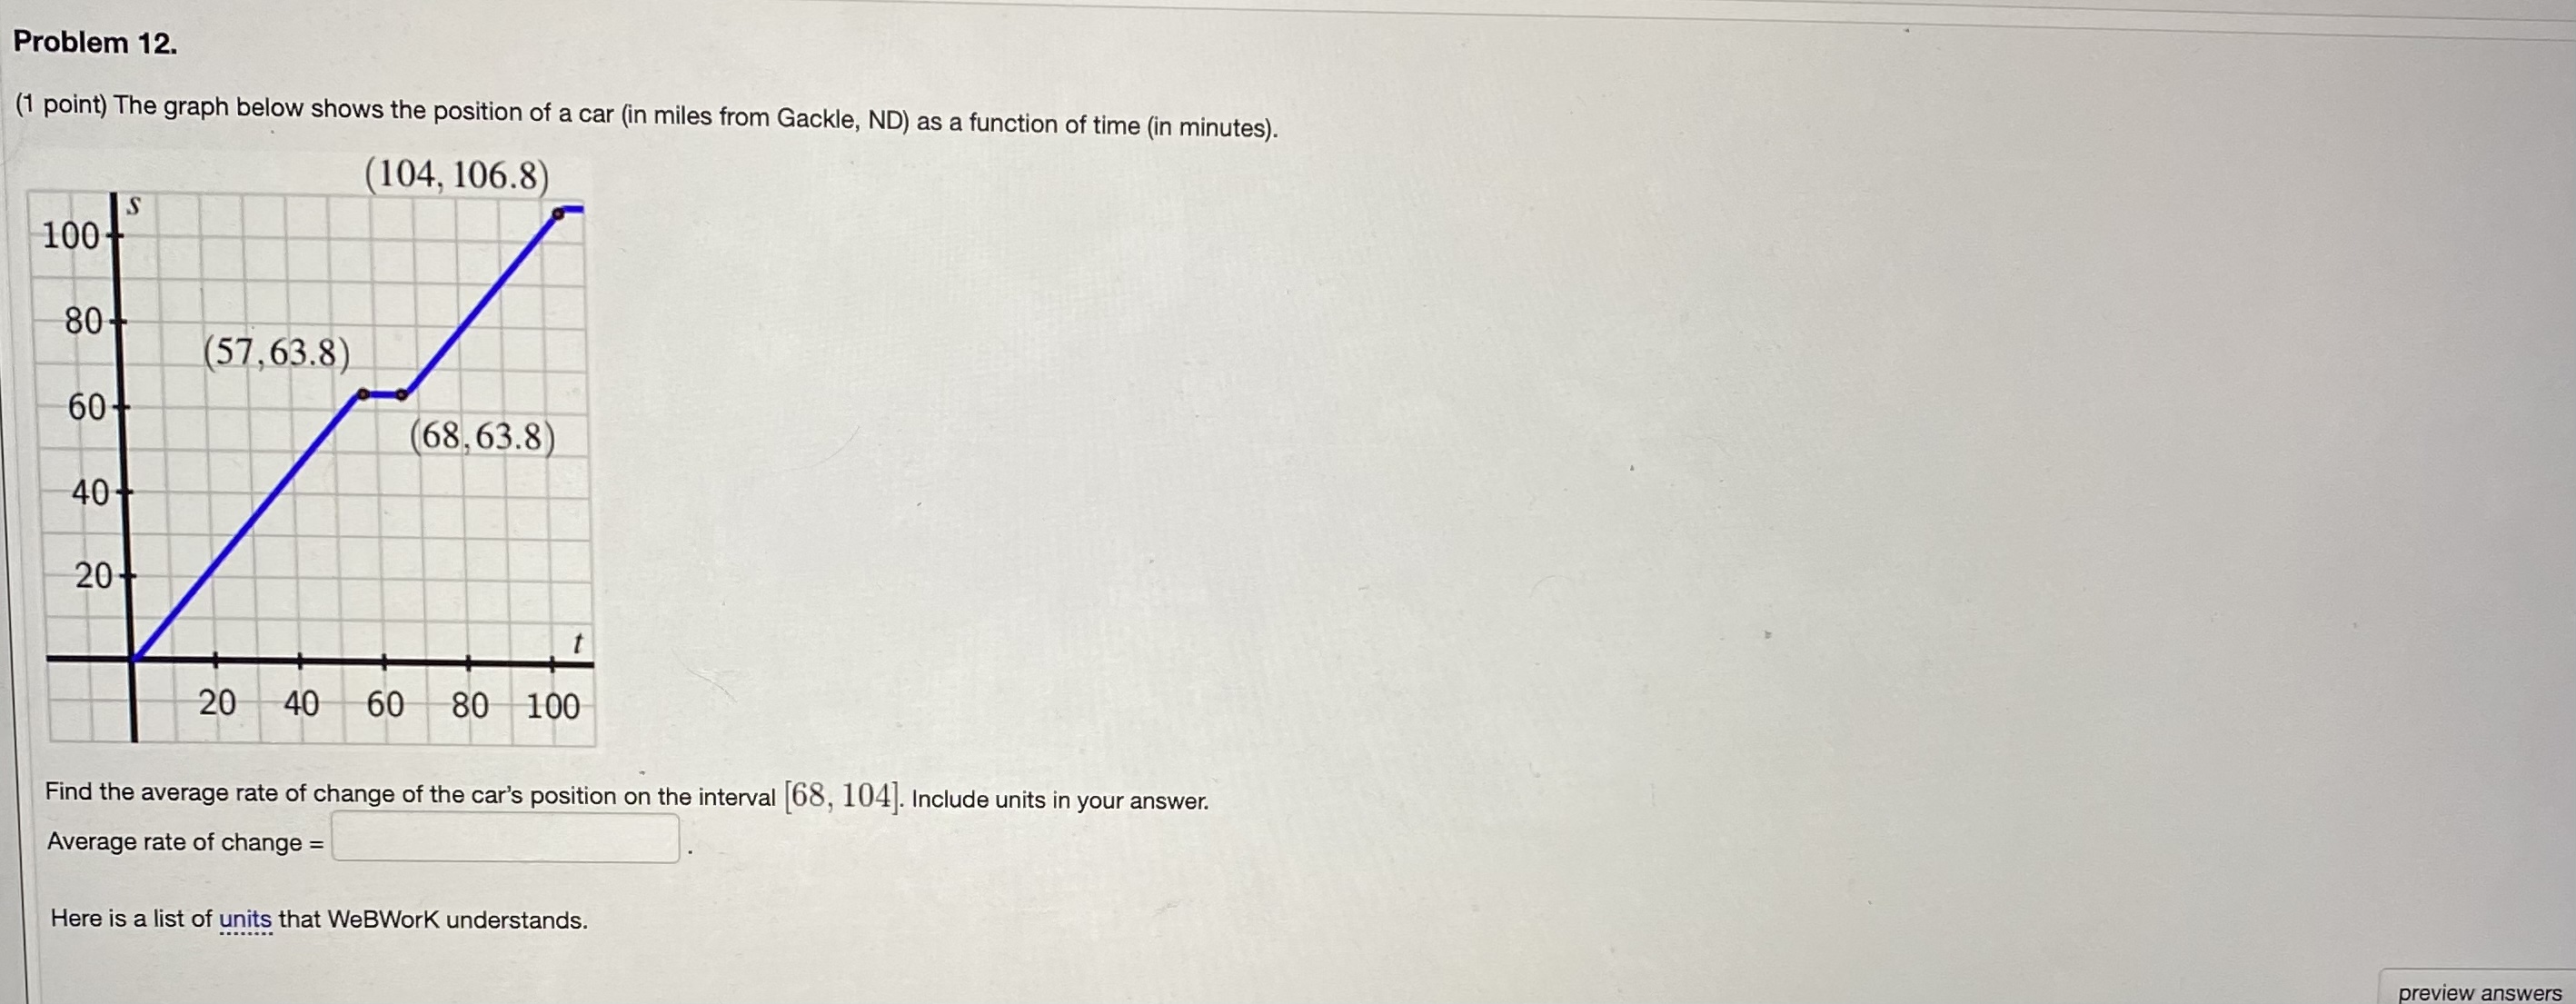

Problem 12. (1 point) The graph below shows the position of a car (in miles from Gackle, ND) as a function of time (in minutes). (104, 106.8) 100 IS 80- (57,63.8) 60- (68, 63.8 40- 20- 20 40 60 80 100 Find the average rate of change of the car's position on the interval [68, 104). Include units in your answer. Average rate of change = Here is a list of units that WeBWork understands. preview answers
Step by Step Solution
There are 3 Steps involved in it
1 Expert Approved Answer
Step: 1 Unlock

Question Has Been Solved by an Expert!
Get step-by-step solutions from verified subject matter experts
Step: 2 Unlock
Step: 3 Unlock