Question: Problem 1-24 points (Questions a, b, c, d, e, and f= 4 points) Ella's Kitchen is a large scale producer of organic baby food. They
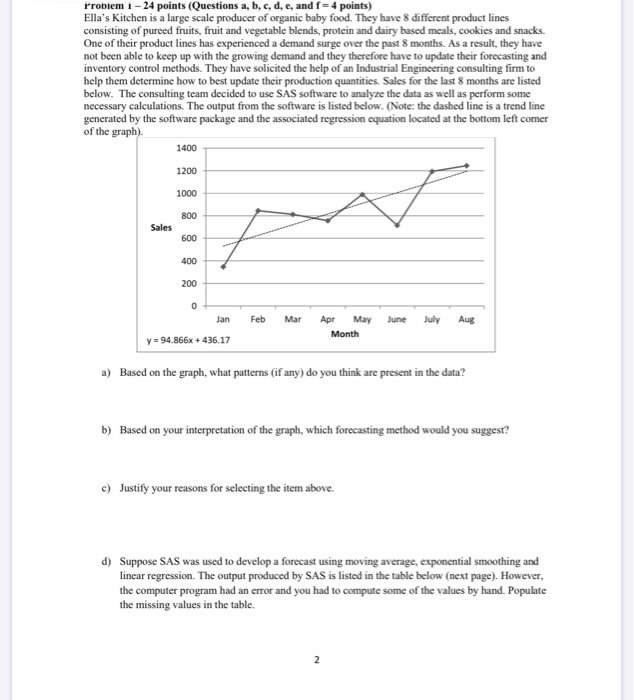
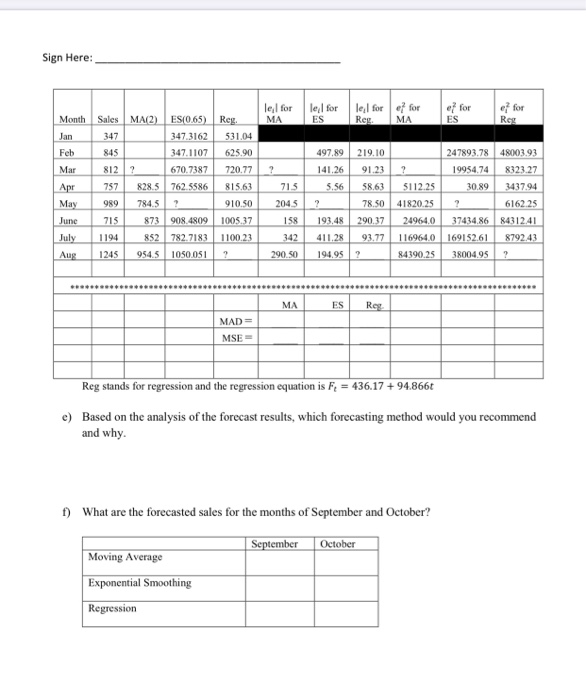
Problem 1-24 points (Questions a, b, c, d, e, and f= 4 points) Ella's Kitchen is a large scale producer of organic baby food. They have 8 different product lines consisting of pureed fruits, fruit and vegetable blends, protein and dairy based meals, cookies and snacks. One of their product lines has experienced a demand surge over the past 8 months. As a result, they have not been able to keep up with the growing demand and they therefore have to update their forecasting and inventory control methods. They have solicited the help of an Industrial Engineering consulting firm to help them determine how to best update their production quantities. Sales for the last 8 months are listed below. The consulting team decided to use SAS software to analyze the data as well as perform some necessary calculations. The output from the software is listed below. (Note: the dashed line is a trend line generated by the software package and the associated regression equation located at the bottom left comer of the graph). 1400 1200 Feb Mar June July Aug Jan y = 94.866x + 436.17 Apr May Month a) Based on the graph, what patterns (if any) do you think are present in the data? b) Based on your interpretation of the graph, which forecasting method would you suggest? c) Justify your reasons for selecting the item above. d) Suppose SAS was used to develop a forecast using moving average, exponential smoothing and linear regression. The output produced by SAS is listed in the table below (next page). However, the computer program had an error and you had to compute some of the values by hand. Populate the missing values in the table. Sign Here: lel for MA lel for ES lezl for Reg. for MA e for ES Month e for Reg Jan 347 845 Feb Mar Apr May June July Aug Sales MA/2) ES(0.65) Reg. 347.3162 531.04 347.1107 625.90 812 ? 670.7387 720.77 757 828. 5 762 5586 815.63 989 784.5 ? 910.50 715 873 908.4809100537 1194 852 782.7183 1100.23 1245 954. 51050.051 ? ? 715 2045 1 58 342 290.50 497.89 141.26 5.56 ? 193.48 411.28 194.952 219.10 91.23 58.63 78.50 290,37 93.77 ? 5112.25 41820.25 24964.0 116964.0 8 4390.25 247893.78 19954.74 30.89 ? 37434.86 169152.61 38004.95 48003.93 8323.27 3437.94 6162.25 8431241 8792.43 ? ES - Ros Reg stands for regression and the regression equation is F = 436.17 +94.866t e) Based on the analysis of the forecast results, which forecasting method would you recommend and why. 1) What are the forecasted sales for the months of September and October? September October Moving Average Exponential Smoothing Regression