

Question: Problem 13 Use MATLAB to plot the following time-dependent signals in the same figure a. St exp(t),e (0,2) signals in the Each curve should entail
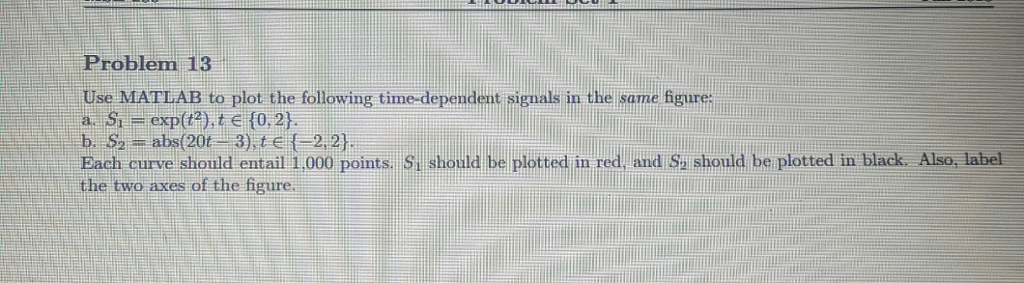
Problem 13 Use MATLAB to plot the following time-dependent signals in the same figure a. St exp(t),e (0,2) signals in the Each curve should entail 1.000 points. Si shoul plotted in red, and S2 should bei plotted in black. Also, label the two axes of the figure
Step by Step Solution
There are 3 Steps involved in it
1 Expert Approved Answer
Step: 1 Unlock

Question Has Been Solved by an Expert!
Get step-by-step solutions from verified subject matter experts
Step: 2 Unlock
Step: 3 Unlock