

Question: Problem 13-10 Returns and Standard Deviations. 19 XB A5 Returns and standard deviations - Excel ? X FILE HOME INSERT PAGE LAYOUT FORMULAS DATA REVIEW
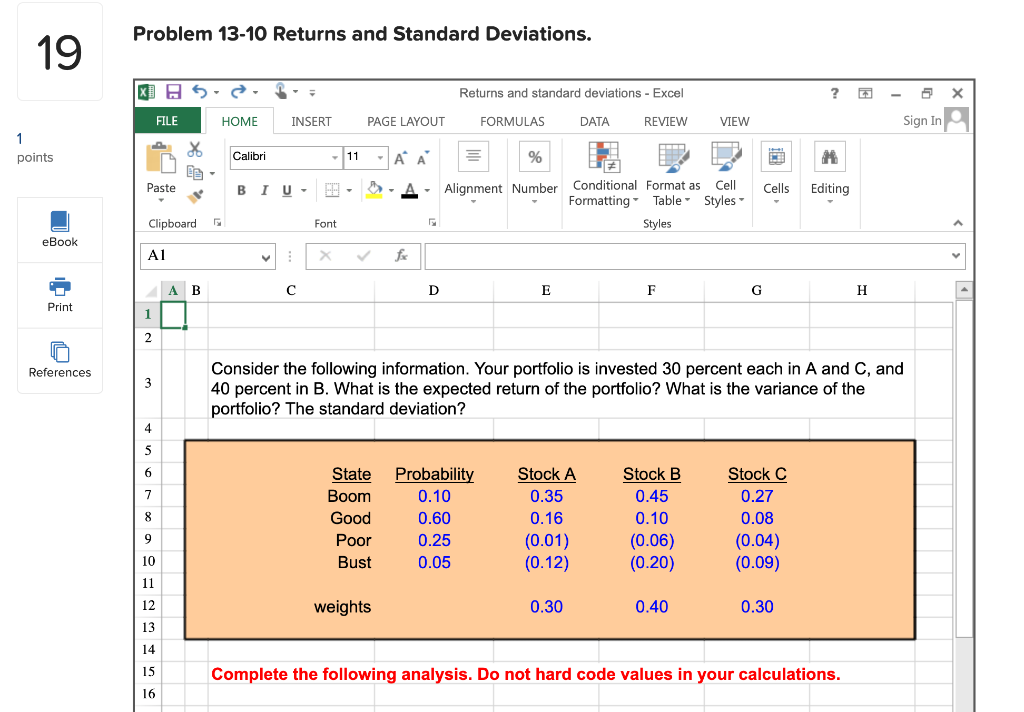
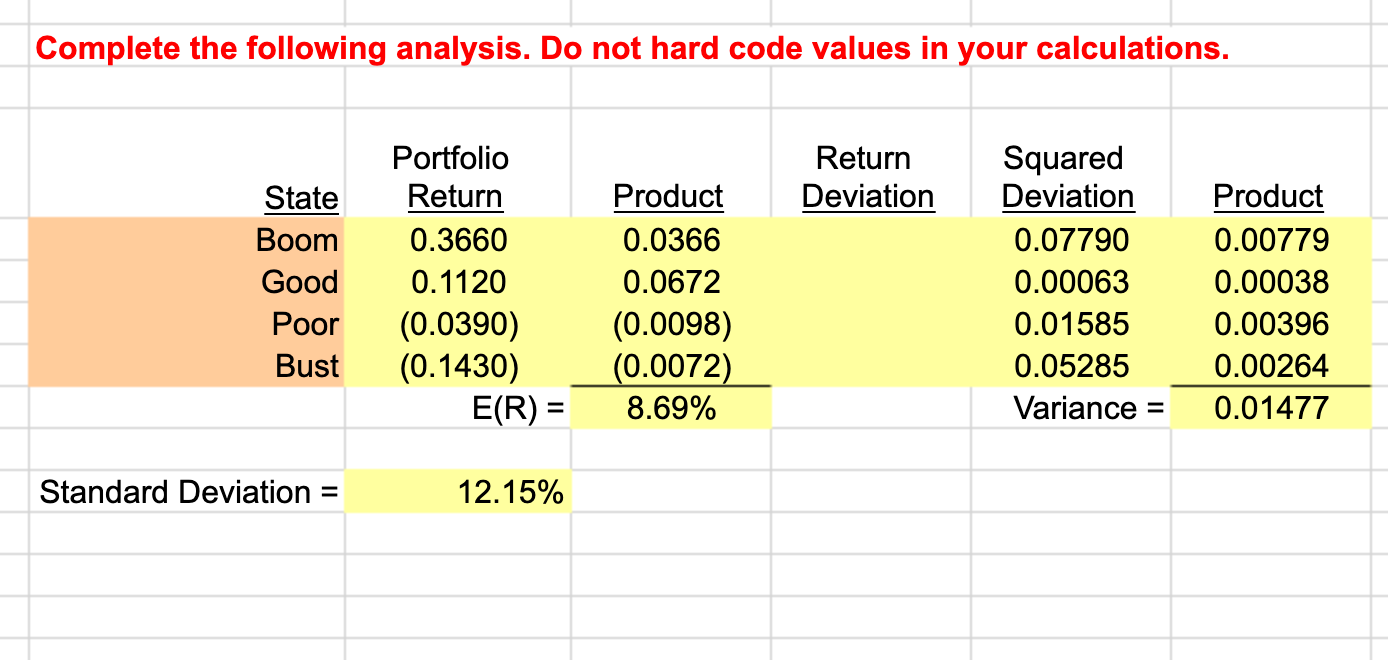
Problem 13-10 Returns and Standard Deviations. 19 XB A5 Returns and standard deviations - Excel ? X FILE HOME INSERT PAGE LAYOUT FORMULAS DATA REVIEW VIEW Sign In 1 points X Calibri 11 - A % D- Paste BIU- -A- Alignment Number Conditional Format as Cell Formatting Table Styles Cells Editing Clipboard Font Styles eBook AL A B C D E F G H Print 1 2 References 3 Consider the following information. Your portfolio is invested 30 percent each in A and C, and 40 percent in B. What is the expected return of the portfolio? What is the variance of the portfolio? The standard deviation? 4 5 6 7 State Boom Good Poor Bust Probability 0.10 0.60 8 Stock A 0.35 0.16 (0.01) (0.12) Stock B 0.45 0.10 (0.06) (0.20) Stock C 0.27 0.08 (0.04) (0.09) 9 0.25 10 0.05 11 12 weights 0.30 0.40 0.30 13 14 15 Complete the following analysis. Do not hard code values in your calculations. 16 Complete the following analysis. Do not hard code values in your calculations. Return Deviation State Boom Good Poor Bust Portfolio Return 0.3660 0.1120 (0.0390) (0.1430) E(R) = Product 0.0366 0.0672 (0.0098) (0.0072) 8.69% Squared Deviation 0.07790 0.00063 0.01585 0.05285 Variance Product 0.00779 0.00038 0.00396 0.00264 0.01477 = Standard Deviation 12.15%
Step by Step Solution
There are 3 Steps involved in it

Get step-by-step solutions from verified subject matter experts