

Problem 13-1A Calculation and analysis of trend percents LO A1, P1 Selected comparative financial statements of...
Fantastic news! We've Found the answer you've been seeking!
Question:
Transcribed Image Text:
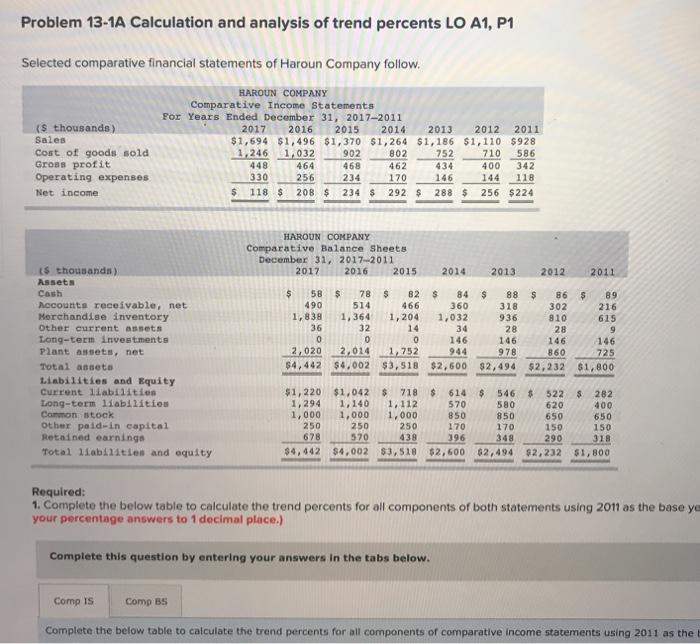
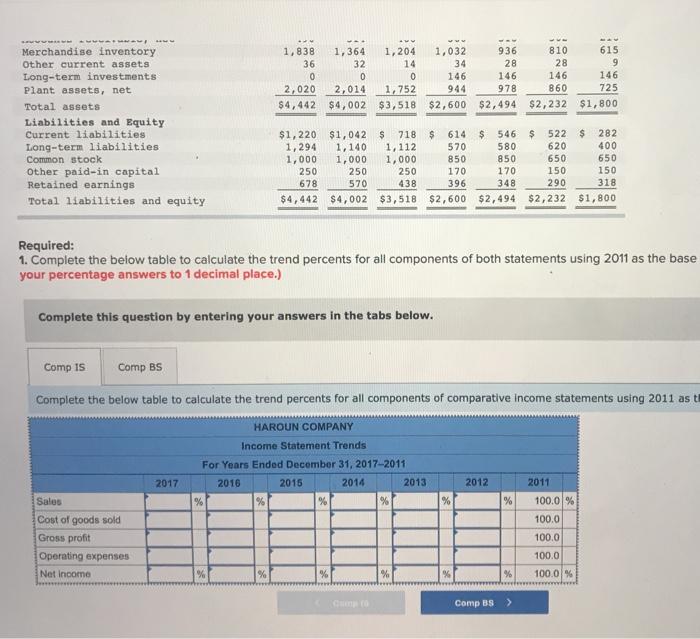
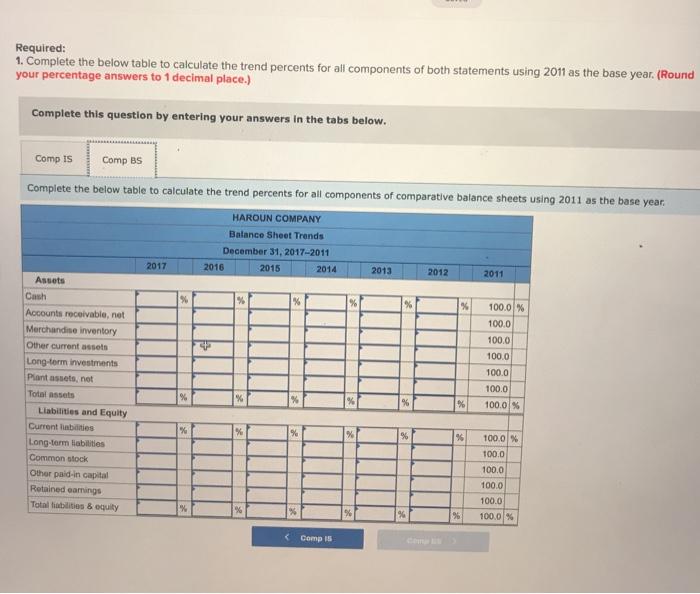
Problem 13-1A Calculation and analysis of trend percents LO A1, P1 Selected comparative financial statements of Haroun Company follow. HAROUN COMPANY Comparative Income Statements For Years Ended December 31, 2017-2011 (S thousands) Sales 2017 2016 2015 2014 2013 2012 2011 $1,694 $1,496 $1,370 $1,264 $1,186 $1,110 $928 586 342 118 710 Cost of goods sold Groas profit Operating expenses 1,246 1,032 902 468 802 752 434 146 448 464 462 400 330 256 234 170 144 Net income $ 118 $ 208 $ 234S 292 $ 288 $ 256 $224 HAROUN COMPANY Comparative Balance Sheets December 31, 2017-2011 2017 LS thousandn) 2016 2015 2014 2013 2012 2011 Assets Cash Accounts receivable, net Merchandise inventory Other current assets Long-term investments Plant ansets, net 58 $ 490 1,838 36 78 $ 82 $ 466 1,204 84 360 1,032 34 88 318 86 $ 89 514 302 216 1,364 32 936 810 615 14 28 28 0. 146 146 978 146 146 2,014 2,020 $4,442 $4,002 $3,518 $2,600 $2,494 $2,232 1,752 944 860 725 Total assets $1,800 Liabilities and Equity Current liabilitien Long-term liabilitios Common stock Other paid-in capital Retained earnings $1,220 $1,042 1,294 1,000 250 718 $ 1,112 1,000 250 138 $4,442 $4,002 $3,518 614 546 $ 522 $ 620 282 400 1,140 1,000 250 570 580 850 850 650 650 170 170 150 150 678 570 290 $2,600 62,494 $2, 232 396 348 318 Total 1iabil1ities and equity $1,800 Required: 1. Complete the below table to calculate the trend percents for all components of both statements using 2011 as the base ye your percentage answers to 1 decimal place.) Complete this question by entering your answers in the tabs below. Comp IS Comp BS Complete the below table to calculate the trend percents for all components of comparative income statements using 2011 as the 1,032 810 615 Merchandise inventory Other current assets 1,838 1,364 32 1,204 14 936 28 36 34 28 9. Long-term investments Plant assetS, net 146 146 146 978 146 2,020 2,014 1,752 944 860 725 Total assets $4,442 $4, 002 $3,518 $2,600 $2,494 $2,232 $1,800 Liabilities and Equity 614 $4 546 282 522 620 Current liabilities Long-term liabilities Common stock $1,220 $1,042 $ 1,294 1,000 718 1,112 1,000 1,140 400 570 850 170 396 580 850 170 348 650 150 1,000 650 Other paid-in capital Retained earnings 150 250 678 250 250 570 438 290 318 Total liabilities and equity $4,442 $4,002 $3,518 $2,600 $2,494 $2,232 $1,800 Required: 1. Complete the beiow table to calculate the trend percents for all components of both statements using 2011 as the base your percentage answers to 1 decimal place.) Complete this question by entering your answers in the tabs below. Comp IS Comp BS Complete the below table to calculate the trend percents for all components of comparative income statements using 2011 as ti HAROUN COMPANY Income Statement Trends For Years Ended December 31, 2017-2011 2017 2016 2015 2014 2013 2012 2011 Sales 100.0 % Cost of goods sold 100.0 Gross profit 100.0 Operating expenses 100.0 Net income 100.0 % Cump to Comp BS Required: 1. Complete the below table to calculate the trend percents for all components of both statements using 2011 as the base year. (Round your percentage answers to 1 decimal place.) Complete this question by entering your answers in the tabs below. Comp IS Comp BS Complete the below table to calculate the trend percents for all components of comparative balance sheets using 2011 as the base year. HAROUN COMPANY Balance Sheet Trends December 31, 2017-2011 2017 2016 2015 2014 2013 2012 2011 Assets Cash Accounts receivable, net Merchandise inventory % 100.0 % 100.0 100.0 Other current assets 100.0 Long-term investments Plant assets, net 100.0 100.0 Total assets 100.0 % Liabilities and Equity Current liabilities 100.0 % Long-term liabilities 100.0 Common stock 100.0 Other paid-in capital Retained eamings 100.0 100.0 Tolal tabilities & equity 100.0 % < Comp IS Com Problem 13-1A Calculation and analysis of trend percents LO A1, P1 Selected comparative financial statements of Haroun Company follow. HAROUN COMPANY Comparative Income Statements For Years Ended December 31, 2017-2011 (S thousands) Sales 2017 2016 2015 2014 2013 2012 2011 $1,694 $1,496 $1,370 $1,264 $1,186 $1,110 $928 586 342 118 710 Cost of goods sold Groas profit Operating expenses 1,246 1,032 902 468 802 752 434 146 448 464 462 400 330 256 234 170 144 Net income $ 118 $ 208 $ 234S 292 $ 288 $ 256 $224 HAROUN COMPANY Comparative Balance Sheets December 31, 2017-2011 2017 LS thousandn) 2016 2015 2014 2013 2012 2011 Assets Cash Accounts receivable, net Merchandise inventory Other current assets Long-term investments Plant ansets, net 58 $ 490 1,838 36 78 $ 82 $ 466 1,204 84 360 1,032 34 88 318 86 $ 89 514 302 216 1,364 32 936 810 615 14 28 28 0. 146 146 978 146 146 2,014 2,020 $4,442 $4,002 $3,518 $2,600 $2,494 $2,232 1,752 944 860 725 Total assets $1,800 Liabilities and Equity Current liabilitien Long-term liabilitios Common stock Other paid-in capital Retained earnings $1,220 $1,042 1,294 1,000 250 718 $ 1,112 1,000 250 138 $4,442 $4,002 $3,518 614 546 $ 522 $ 620 282 400 1,140 1,000 250 570 580 850 850 650 650 170 170 150 150 678 570 290 $2,600 62,494 $2, 232 396 348 318 Total 1iabil1ities and equity $1,800 Required: 1. Complete the below table to calculate the trend percents for all components of both statements using 2011 as the base ye your percentage answers to 1 decimal place.) Complete this question by entering your answers in the tabs below. Comp IS Comp BS Complete the below table to calculate the trend percents for all components of comparative income statements using 2011 as the 1,032 810 615 Merchandise inventory Other current assets 1,838 1,364 32 1,204 14 936 28 36 34 28 9. Long-term investments Plant assetS, net 146 146 146 978 146 2,020 2,014 1,752 944 860 725 Total assets $4,442 $4, 002 $3,518 $2,600 $2,494 $2,232 $1,800 Liabilities and Equity 614 $4 546 282 522 620 Current liabilities Long-term liabilities Common stock $1,220 $1,042 $ 1,294 1,000 718 1,112 1,000 1,140 400 570 850 170 396 580 850 170 348 650 150 1,000 650 Other paid-in capital Retained earnings 150 250 678 250 250 570 438 290 318 Total liabilities and equity $4,442 $4,002 $3,518 $2,600 $2,494 $2,232 $1,800 Required: 1. Complete the beiow table to calculate the trend percents for all components of both statements using 2011 as the base your percentage answers to 1 decimal place.) Complete this question by entering your answers in the tabs below. Comp IS Comp BS Complete the below table to calculate the trend percents for all components of comparative income statements using 2011 as ti HAROUN COMPANY Income Statement Trends For Years Ended December 31, 2017-2011 2017 2016 2015 2014 2013 2012 2011 Sales 100.0 % Cost of goods sold 100.0 Gross profit 100.0 Operating expenses 100.0 Net income 100.0 % Cump to Comp BS Required: 1. Complete the below table to calculate the trend percents for all components of both statements using 2011 as the base year. (Round your percentage answers to 1 decimal place.) Complete this question by entering your answers in the tabs below. Comp IS Comp BS Complete the below table to calculate the trend percents for all components of comparative balance sheets using 2011 as the base year. HAROUN COMPANY Balance Sheet Trends December 31, 2017-2011 2017 2016 2015 2014 2013 2012 2011 Assets Cash Accounts receivable, net Merchandise inventory % 100.0 % 100.0 100.0 Other current assets 100.0 Long-term investments Plant assets, net 100.0 100.0 Total assets 100.0 % Liabilities and Equity Current liabilities 100.0 % Long-term liabilities 100.0 Common stock 100.0 Other paid-in capital Retained eamings 100.0 100.0 Tolal tabilities & equity 100.0 % < Comp IS Com
Expert Answer:

Related Book For 
Fundamental accounting principle
ISBN: 978-0078025587
21st edition
Authors: John J. Wild, Ken W. Shaw, Barbara Chiappetta
Posted Date:
Students also viewed these accounting questions
-
Selected comparative financial statements of Haroun Company follow. Required 1. Compute trend percents for all components of both statements using 2008 as the base year. (Round percents to one...
-
Selected comparative financial statements of Haroun Company follow. HAROUN COMPANY Comparative Income Statements For Years Ended December 31, 2016-2010 HAROUN COMPANY Comparative Balance Sheets...
-
Financial statement data for the years ended December 31 for Blum Company are shown below. a. Determine the accounts receivable turnover for 2015 and 2014. Round to one decimal place. b. Determine...
-
Describe three ways in which a gradual increase in an extracellular signal can be sharpened by the target cell to produce an abrupt or nearly all-or none response.
-
The height of the demand curve at a given quantity reflects the marginal valuation of the last unit of that good consumed. For a normal good, an increase in income shifts the demand curve to the...
-
If a population consists of the positive even numbers through 30 and if A = {2, 6, 12, 24}, what is A ?
-
What would happen to the SML graph in Figure 8.8 if expected inflation increased or decreased? Figure 8.8 268 269 270 271 272 273 274 275 A Required Rate of Return TH-13.0% SML: r, RF+RPM * b D E F H...
-
Kathleen McFadden, vice president of operations at Jackson Manufacturing Company, has just received a request for quote (RFQ) from DeKalb Electric Supply for 400 units per week of a motor armature,...
-
decribe the health sttsus of unit members (if any of the family describe below)Mother (29yo) and Father (32yo) 2 children (1 elementary, 1 high school) Origin: Mohawk (from Kahnawake) Address: 295,...
-
Compute the mean and median for the duration of hospitalization for the 25 patients? Table 2.13: Hospital-stay data First WBC Received Duration First Received bacterial Sex 1 = M 2 = F (x 10)...
-
Two forces P and Q are applied to the lid of a storage bin as shown. Knowing that P = 60 N and Q = 48 N, determine by trigonometry the magnitude and direction of the resultant of the two forces. %3D...
-
ABC Co has a target debt ratio of 40% and it keeps this target. The cost of equity is 10% and the cost of debt is 4%. It is considering expanding its business and requires $1 million investment....
-
Consider an economy where there is uncertainty about the future. In particular, at the current date t all agents are unsure which of the 3 possible states (w1, W2, W3) will mate- rialize at date t+...
-
A number of investment strategies based on risk factor research have been lumped under the heading "smart beta," but are they smart? What are the arguments for and against smart beta strategies and...
-
The pharmacy's computer system costs $ 950,000 aA pharmacy purchased a bottle of Amoxil for $27.14 and sold it for $42.80. What was the % profitend should last 5 years. Its disposal value is $55,000....
-
Briefly describe the three main processes that utilize ATP as a free energy source.
-
I cannot ping from lan 5.4.22.0 or PC7 out to R4 andthrough serial cable on R4 to R5 and reach the lan that PC5 is on.Please help, GNS3 lab with CISCO routers and debian PCs Overall,ping is not goi 2...
-
What is master production scheduling and how is it done?
-
Refer to Exercise 5-4 and prepare the appropriate journal entries for Baker Co. to record the May 5 purchase and each of the three separate transactions a through c. Baker is a retailer that uses a...
-
Refer to the information from QS 21- 6. How will the break- even point in units change in response to each of the following independent changes in selling price per unit, variable cost per unit, or...
-
Denzel Brooks opens a Web consulting business called Venture Consultants and completes the following transactions in March. March 1 Brooks invested $150,000 cash along with $22,000 in office...
-
Figure P2.4 shows a graph of position versus frame number from a video clip of a moving object. Describe this motion from beginning to end, and state any assumptions you make. Data from Figure P2.4...
-
What minimum information must be extracted from a video clip of a moving object in order to quantify the object's motion?
-
The sequence in Figure P2.3 represents a ball that is initially held above the ground. In the first frame the ball is released. In subsequent frames the ball falls, bounces on the ground, rises, and...

Study smarter with the SolutionInn App