

Question: Problem 13-1A Here are comparative statement data for Wildhorse Company and Sandhill Company, two competitors. All balance sheet data are as of December 31, 2017,
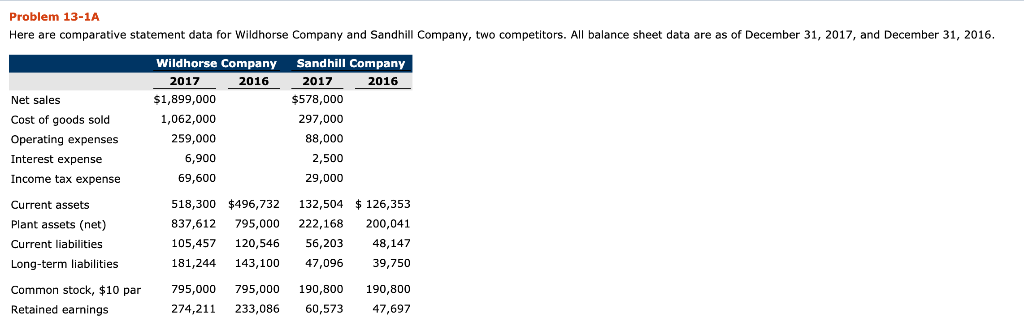
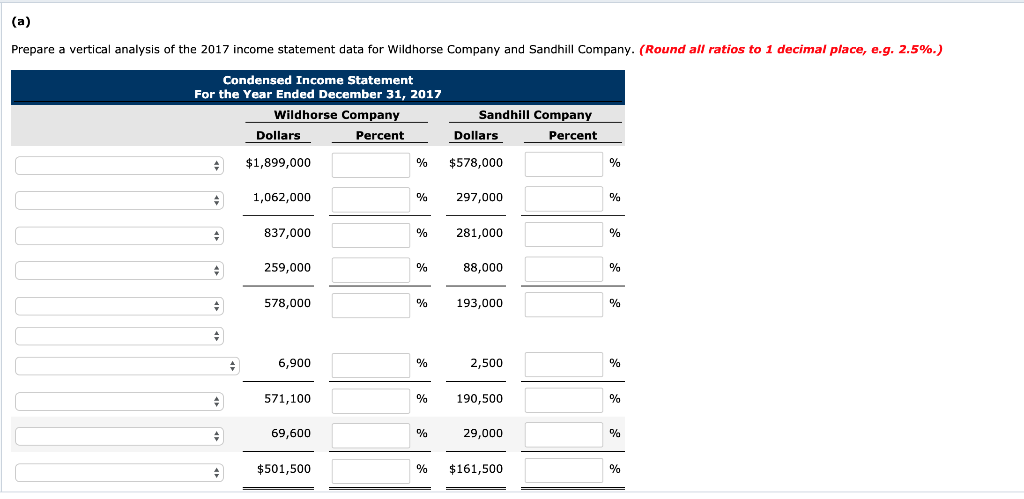
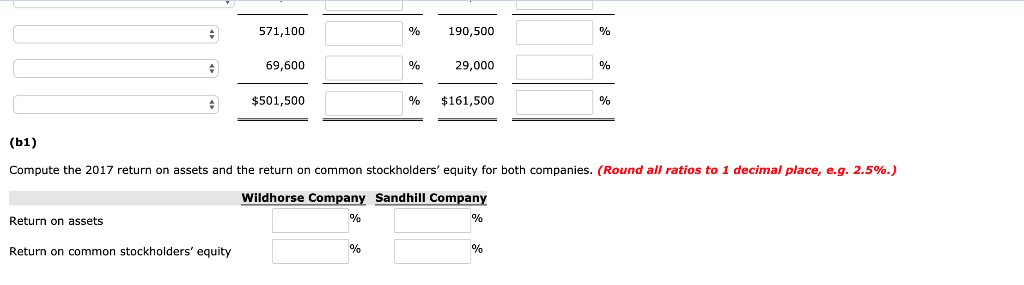
Problem 13-1A Here are comparative statement data for Wildhorse Company and Sandhill Company, two competitors. All balance sheet data are as of December 31, 2017, and December 31, 2016. Wildhorse Company Sandhill Company 2017 2016 2017 2016 $1,899,000 $578,000 Net sales Cost of goods sold 1,062,000 297,000 259,000 88,000 Operating expenses 6,900 2,500 Interest expense Income tax expense 69,600 29,000 132,504 126,353 518,300 $496,732 Current assets Plant assets (net) 837,612 795,000 222,168 200,041 105,457 120,546 56,203 48,147 Current liabilities 181,244 143,100 47,096 Long-term liabilities 39,750 Common stock, $10 par 795,000 795,000 190,800 190,800 Retained earnings 274,211 233,086 60.573 47,697 (a) Prepare a vertical analysis of the 2017 income statement data for Wild horse Company and Sandhill Company. (Round all ratios to 1 decimal place, e.g. 2.5%.) Condensed Income Statement For the Year Ended December 31, 2017 Wildhorse Company Sandhill Company Percent Percent Dollars Dollars $1,899,000 o% $578,000 1,062,000 297,000 837,000 % 281,000 % 0e 259,000 0/ 88,000 578,000 193,000 6,900 2,500 571,100 190,500 69,600 29,000 % $501,500 % $161,500 190,500 571,100 69,600 29,000 $501,500 $161,500 (b1) Compute the 2017 return on assets and the return on common stockholders' equity for both companies. (Round all ratios to 1 decimal place, e.g. 2.5%.) Wildhorse Company Sandhill Company Return on assets % % Return on common stockholders' equity
Step by Step Solution
There are 3 Steps involved in it

Get step-by-step solutions from verified subject matter experts