

Question: Problem 13-1A (Part Level Submission) Here are comparative statement data for Crane Company and Sheridan Company, two competitors. All balance sheet data are as of
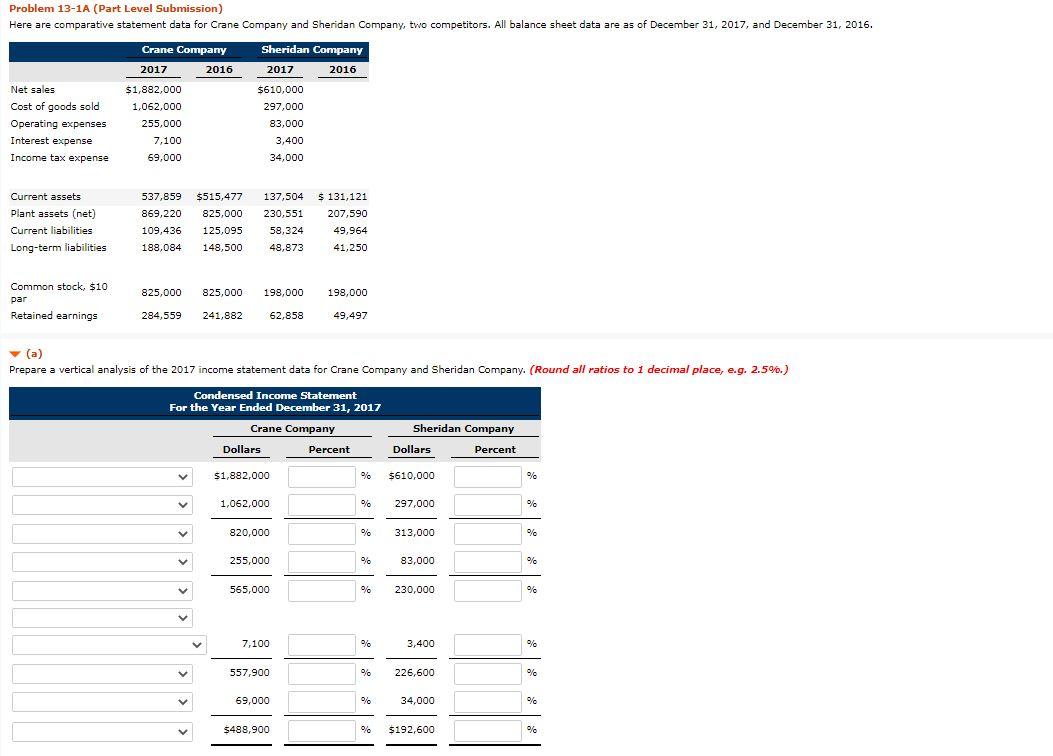
Problem 13-1A (Part Level Submission) Here are comparative statement data for Crane Company and Sheridan Company, two competitors. All balance sheet data are as of December 31, 2017, and December 31, 2016. Crane Company Sheridan Company 2017 2016 2017 2016 Net sales Cost of goods sold Operating expenses Interest expense Income tax expense $1,882,000 1,062,000 255,000 7,100 69,000 $610,000 297,000 83,000 3,400 34,000 137,504 $ 131,121 Current assets Plant assets (net) Current liabilities Long-term liabilities 537,859 869,220 109,436 230,551 $515,477 825,000 125,095 148.500 58,324 48,873 207,590 49,964 41,250 188.084 Common stock. $10 par 825,000 825,000 198,000 198,000 Retained earnings 284,559 241,882 62,858 49,497 Prepare a vertical analysis of the 2017 income statement data for Crane Company and Sheridan Company. (Round all ratios to 1 decimal place, e.g. 2.590.) Condensed Income Statement For the Year Ended December 31, 2017 Crane Company Sheridan Company Dollars Percent Dollars Percent 51,882,000 % $610,000 % 1,062,000 % 297,000 % V 820,000 % 313,000 255,000 % 83,000 % V 565,000 % 230,000 % 7,100 % 3,400 % 557,900 % 226,600 % 69,000 34,000 V $489,900 % $192,600 %
Step by Step Solution
There are 3 Steps involved in it

Get step-by-step solutions from verified subject matter experts