

Question: Problem 13-1A (Static) Calculating and analyzing trend percents LO P1 Selected comparative financial statements of Haroun Company follow. HAROUN COMPANY Comparative Income Statements For
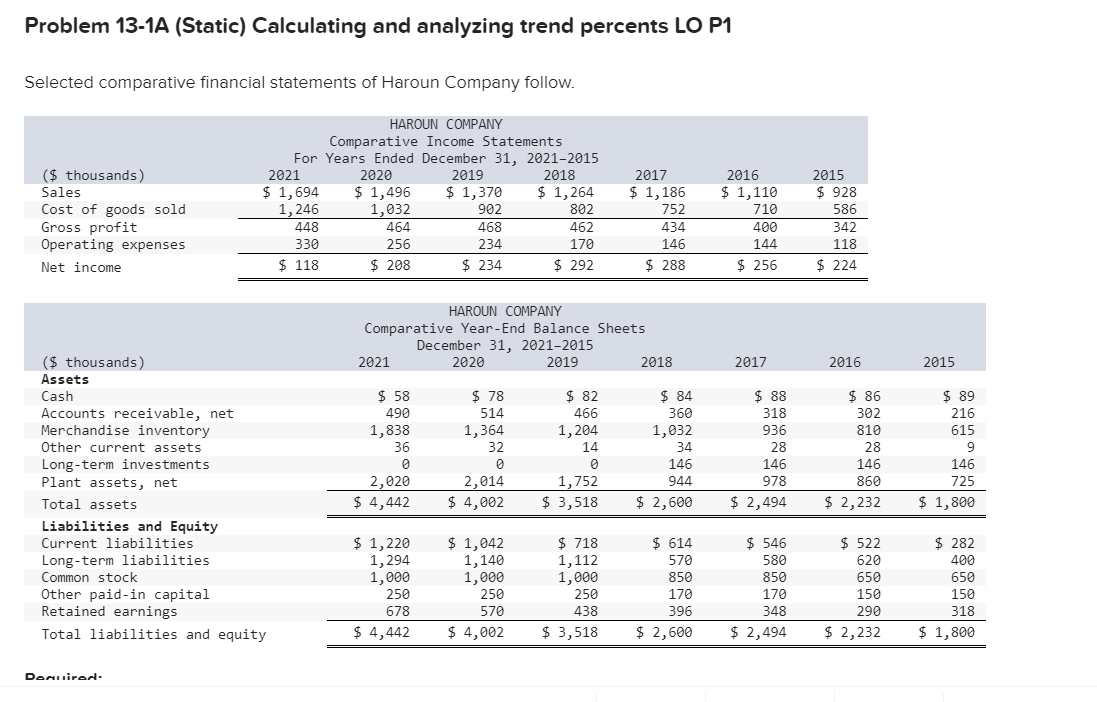
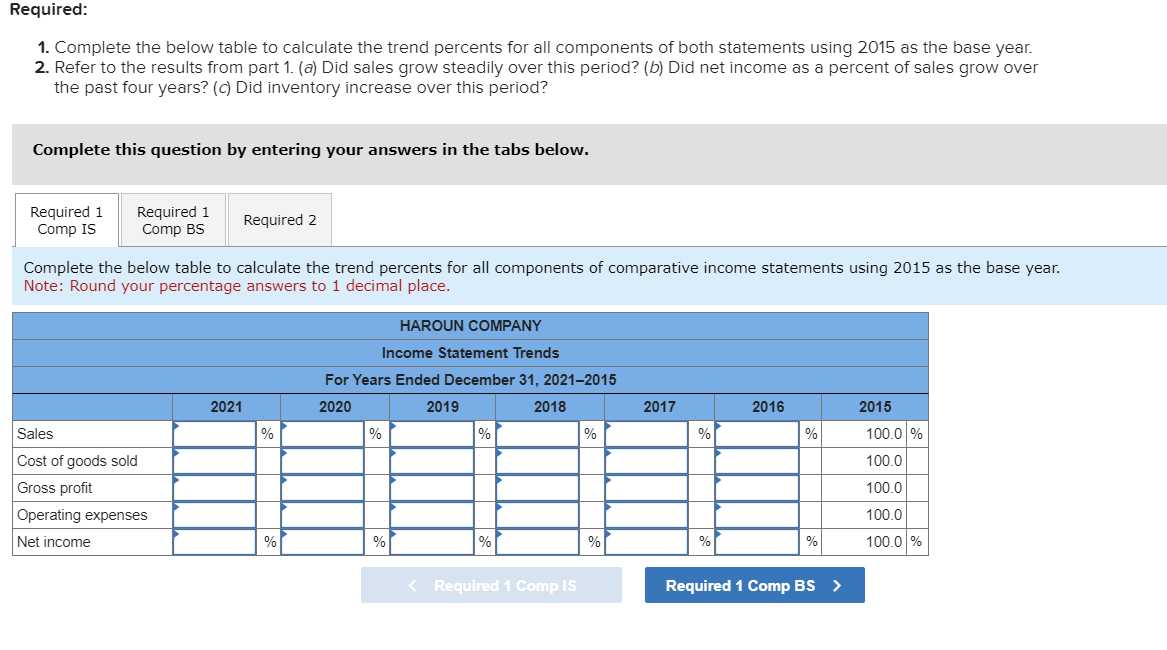
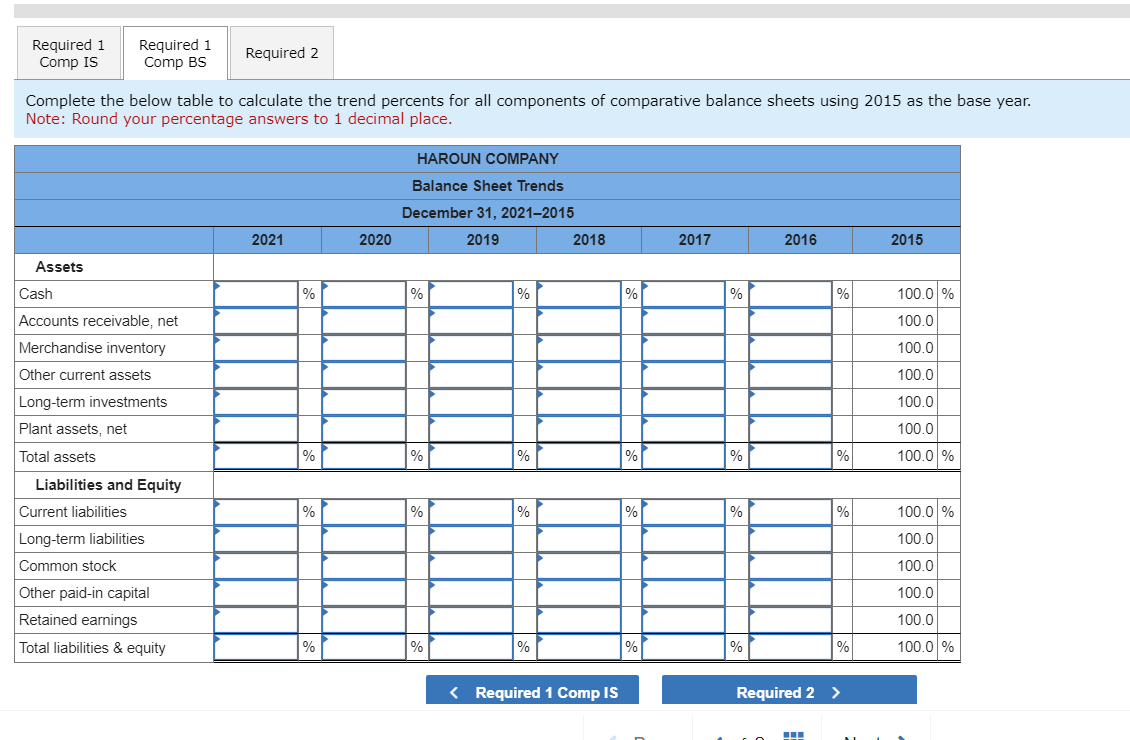
Problem 13-1A (Static) Calculating and analyzing trend percents LO P1 Selected comparative financial statements of Haroun Company follow. HAROUN COMPANY Comparative Income Statements For Years Ended December 31, 2021-2015 ($ thousands) Sales 2021 Cost of goods sold $ 1,694 1,246 2020 $ 1,496 2019 2018 2017 2016 2015 $ 1,370 $ 1,264 $ 1,186 $ 1,110 $ 928 Gross profit 448 1,032 464 902 802 752 710 586 468 462 434 400 342 Operating expenses 330 256 234 170 146 144 118 Net income $ 118 $ 208 $ 234 $ 292 $ 288 $ 256 $ 224 HAROUN COMPANY Comparative Year-End Balance Sheets December 31, 2021-2015 ($ thousands) Assets Cash Accounts receivable, net Merchandise inventory Other current assets Long-term investments 2021 2020 2019 2018 2017 2016 2015 $ 58 490 1,838 36 $ 78 $ 82 $ 84 $ 88 $ 86 $ 89 514 1,364 466 1,204 360 318 302 216 1,032 936 810 615 32 14 34 28 28 9 0 146 146 146 146 Plant assets, net 2,020 2,014 1,752 944 978 860 725 Total assets $ 4,442 $ 4,002 $ 3,518 $ 2,600 $ 2,494 $ 2,232 $ 1,800 Liabilities and Equity Current liabilities $ 1,220 Long-term liabilities 1,294 Common stock 1,000 $ 1,042 1,140 1,000 $ 718 $ 614 $ 546 $ 522 $ 282 1,112 570 580 620 400 1,000 850 850 650 650 Other paid-in capital 250 Retained earnings 678 250 570 250 170 170 150 150 438 396 348 290 318 Total liabilities and equity $ 4,442 $ 4,002 $ 3,518 $ 2,600 $ 2,494 $ 2,232 $ 1,800 Dequired. Required: 1. Complete the below table to calculate the trend percents for all components of both statements using 2015 as the base year. 2. Refer to the results from part 1. (a) Did sales grow steadily over this period? (b) Did net income as a percent of sales grow over the past four years? (c) Did inventory increase over this period? Complete this question by entering your answers in the tabs below. Required 1 Comp IS Required 1 Comp BS Required 2 Complete the below table to calculate the trend percents for all components of comparative income statements using 2015 as the base year. Note: Round your percentage answers to 1 decimal place. HAROUN COMPANY Sales Cost of goods sold Gross profit Operating expenses Net income Income Statement Trends For Years Ended December 31, 2021-2015 2021 2020 2019 2018 2017 2016 2015 % % % % % % 100.0 % 100.0 100.0 100.0 % % % % % % 100.0 % < Required 1 Comp IS Required 1 Comp BS > Required 1 Comp IS Required 1 Comp BS Required 2 Complete the below table to calculate the trend percents for all components of comparative balance sheets using 2015 as the base year. Note: Round your percentage answers to 1 decimal place. 2021 2020 HAROUN COMPANY Balance Sheet Trends December 31, 2021-2015 2019 2018 2017 2016 2015 Assets Cash Accounts receivable, net Merchandise inventory % % % % % % 100.0 % 100.0 100.0 Other current assets 100.0 Long-term investments 100.0 Plant assets, net 100.0 Total assets % % % % % % 100.0 % Liabilities and Equity Current liabilities % % % % % % 100.0% Long-term liabilities 100.0 Common stock 100.0 Other paid-in capital 100.0 Retained earnings 100.0 Total liabilities & equity % % % % % % 100.0 % < Required 1 Comp IS Required 2 >
Step by Step Solution
There are 3 Steps involved in it

Get step-by-step solutions from verified subject matter experts