

Question: Problem 13-20 Probability analysis with a normal curve distribution (LO13-4) Print When returns from a project can be assumed to be normally distributed, such as
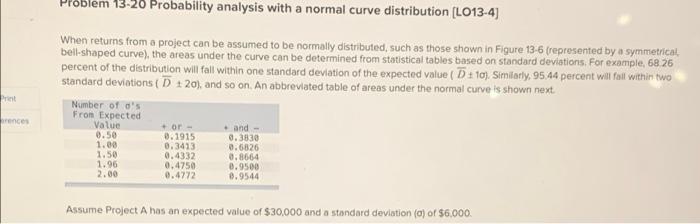
Problem 13-20 Probability analysis with a normal curve distribution (LO13-4) Print When returns from a project can be assumed to be normally distributed, such as those shown in Figure 13-6 represented by a symmetrical bell-shaped curve), the areas under the curve can be determined from statistical tables based on standard deviations. For example, 6826 percent of the distribution will fall within one standard deviation of the expected value D: to). Similarly, 95.44 percent will fail within two standard deviations ( D 120), and so on. An abbreviated table of areas under the normal curve is shown next Number of o's From Expected Value and- 0.1915 0.3830 1.00 0.3413 0.6826 1.50 0.4332 0.8664 1.96 0.4750 0.9500 2.00 0.4772 8.9544 rences + or - 0.50 Assume Project A has an expected value of $30,000 and a standard deviation (a) of $6.000. rences e. What is the probability that the outcome will be less than $27,000 or greater than $39,000? (Round your answer to 4 decimal places.) Probability
Step by Step Solution
There are 3 Steps involved in it

Get step-by-step solutions from verified subject matter experts