

Question: Problem 13-2A Ratios, common-size statements, and trend percents LO P1, P2, P3 [The following information applies to the questions displayed below.] Selected comparative financial statements
![P3 [The following information applies to the questions displayed below.] Selected comparative](https://dsd5zvtm8ll6.cloudfront.net/si.experts.images/questions/2024/09/66e687e7eb730_10366e687e774827.jpg)
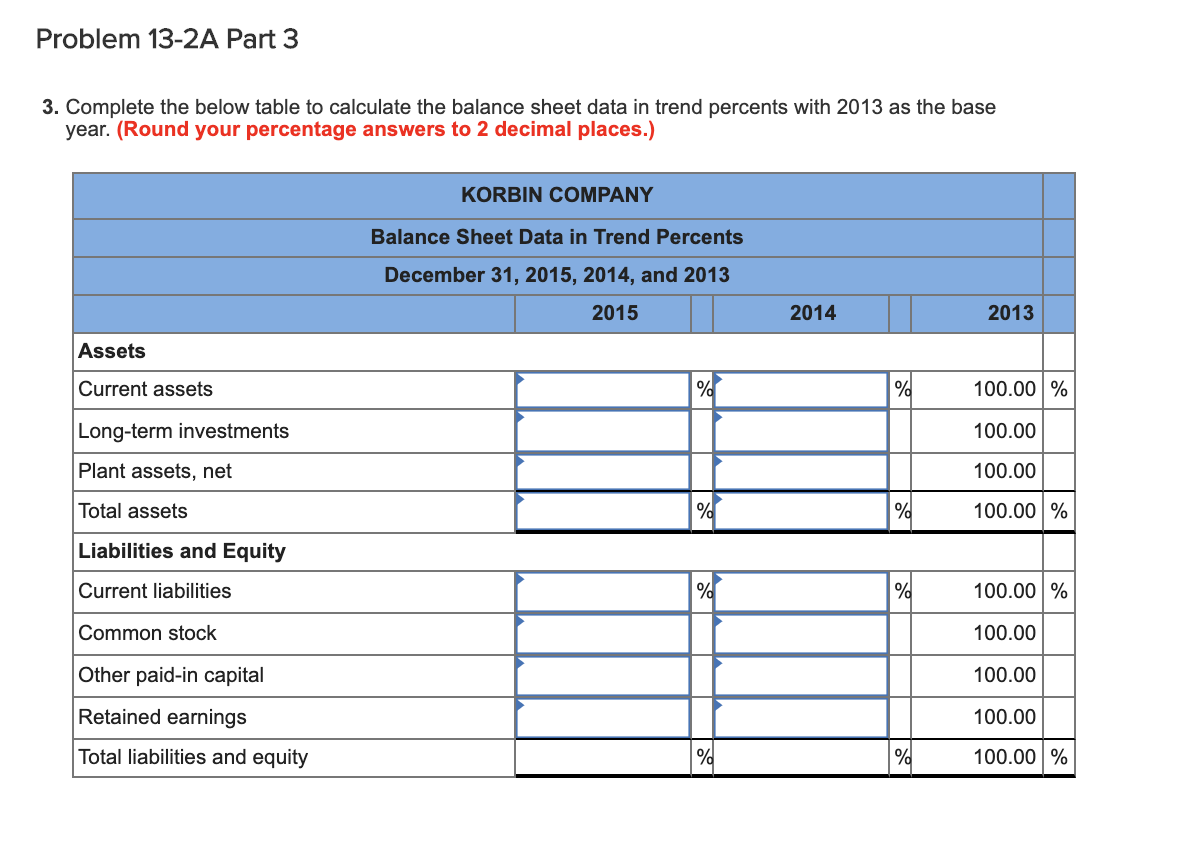
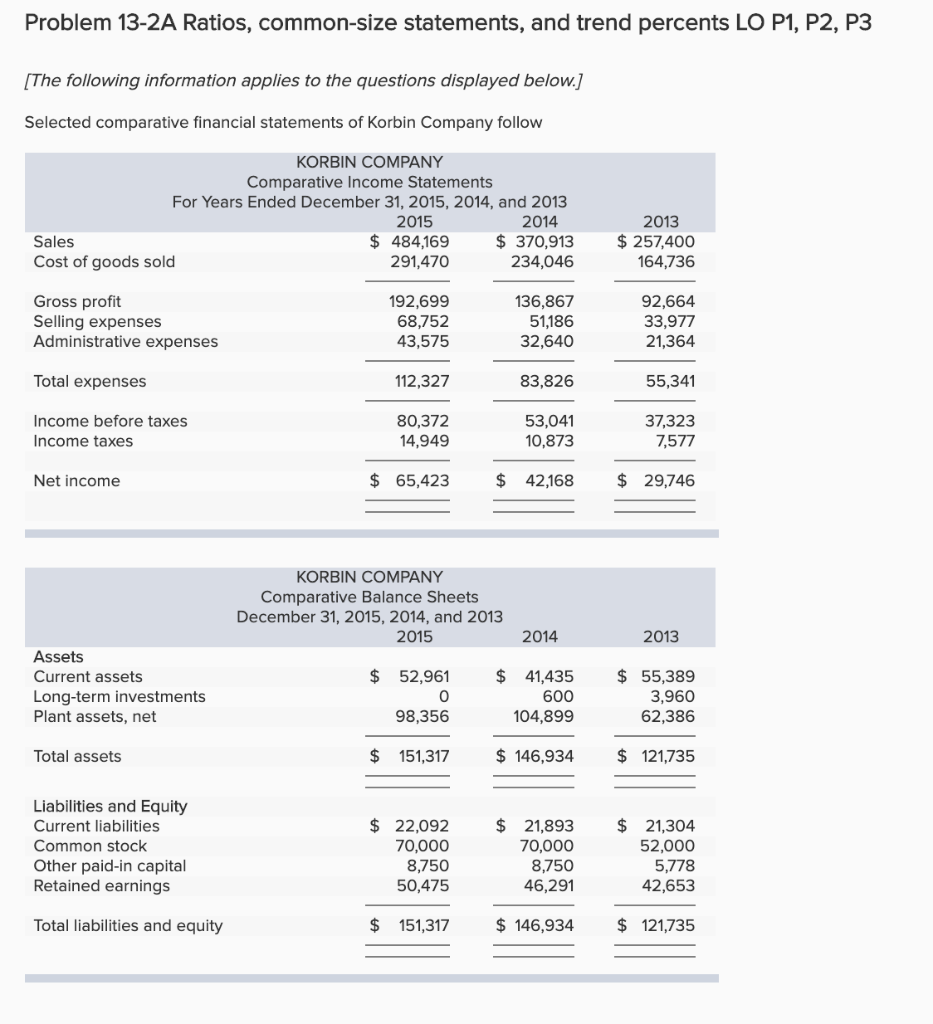
Problem 13-2A Ratios, common-size statements, and trend percents LO P1, P2, P3 [The following information applies to the questions displayed below.] Selected comparative financial statements of Korbin Company follow KORBIN COMPANY Comparative Income Statements For Years Ended December 31, 2015, 2014, and 2013 2015 2014 Sales $ 484,169 $ 370,913 Cost of goods sold 291,470 234,046 2013 $ 257,400 164,736 Gross profit Selling expenses Administrative expenses 192,699 68,752 43,575 136,867 51,186 32,640 92,664 33,977 21,364 Total expenses 112,327 83,826 55,341 Income before taxes Income taxes 80,372 14,949 53,041 10,873 37,323 7,577 Net income $ 65,423 $ 42,168 $ 29,746 KORBIN COMPANY Comparative Balance Sheets December 31, 2015, 2014, and 2013 2015 2014 2013 Assets Current assets Long-term investments Plant assets, net $ 52,961 0 98,356 $ 41,435 600 104,899 $ 55,389 3,960 62,386 Total assets $ 151,317 $ 146,934 $ 121,735 Liabilities and Equity Current liabilities Common stock Other paid-in capital Retained earnings $ 22,092 70,000 8,750 50,475 $ 21,893 70,000 8,750 46,291 $ 21,304 52,000 5,778 42,653 Total liabilities and equity $ 151,317 $ 146,934 $ 121,735 Problem 13-2A Part 2 2. Complete the below table to calculate income statement data in common-size percents. (Round your percentage answers to 2 decimal places.) KORBIN COMPANY Common-Size Comparative Income Statements For Years Ended December 31, 2015, 2014, and 2013 2015 2014 2013 Sales % % % Cost of goods sold Gross profit Selling expenses Administrative expenses Total expenses Income before taxes Income taxes Net income % % % Problem 13-2A Part 3 3. Complete the below table to calculate the balance sheet data in trend percents with 2013 as the base year. (Round your percentage answers to 2 decimal places.) KORBIN COMPANY Balance Sheet Data in Trend Percents December 31, 2015, 2014, and 2013 2015 2014 2013 Assets Current assets % ad 100.00 % Long-term investments 100.00 Plant assets, net 100.00 Total assets % 100.00% Liabilities and Equity Current liabilities % ad 100.00% Common stock 100.00 Other paid-in capital 100.00 100.00 Retained earnings Total liabilities and equity 100.00 %
Step by Step Solution
There are 3 Steps involved in it

Get step-by-step solutions from verified subject matter experts