

Question: Problem 13.6 We would like to describe the relationship between the mean adult female body mass (in kg) of grizzly bears (y) and the percentage
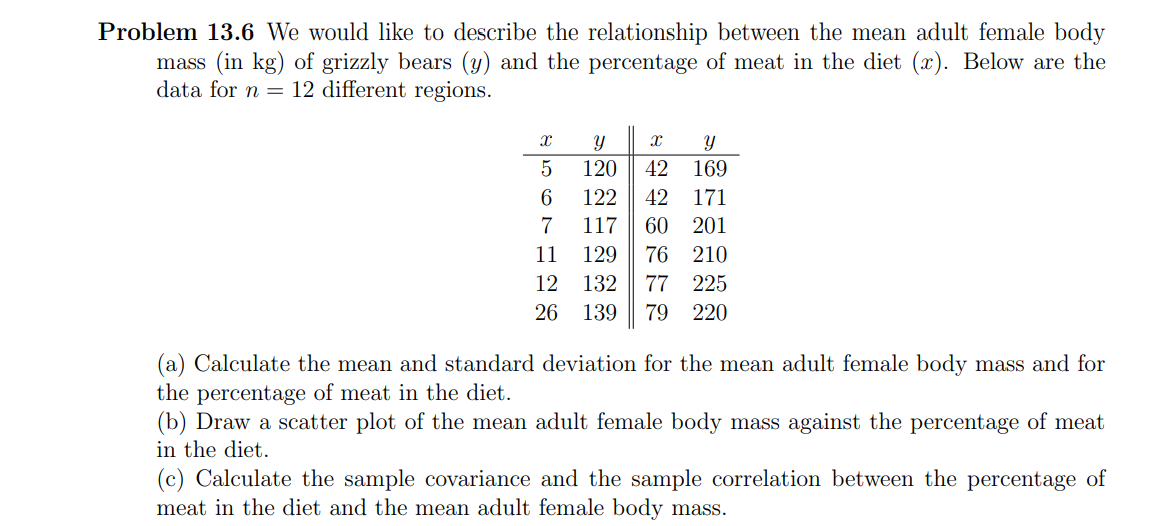
Problem 13.6 We would like to describe the relationship between the mean adult female body mass (in kg) of grizzly bears (y) and the percentage of meat in the diet (:5). Below are the data for n = 12 different regions. 3: 5 120 42 169 6 122 42 171 7 117 60 201 11 129 76 210 12 132 77 225 26 139 79 220 (a) Calculate the mean and standard deviation for the mean adult female body mass and for the percentage of meat in the diet. (b) Draw a scatter plot of the mean adult female body mass against the percentage of meat in the diet. (c) Calculate the sample covariance and the sample correlation between the percentage of meat in the diet and the mean adult female body mass
Step by Step Solution
There are 3 Steps involved in it

Get step-by-step solutions from verified subject matter experts