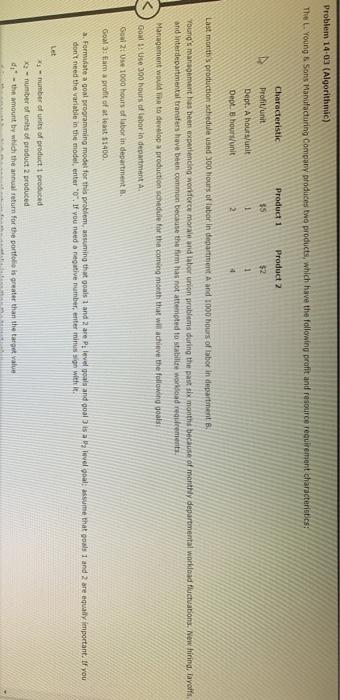
Question: Problem 14-03 (Algorithmic) The L. Young & Sons Marvutacturing Company produces two products, which have the following profit and resource requirement characteristics: Characteristic Product 1
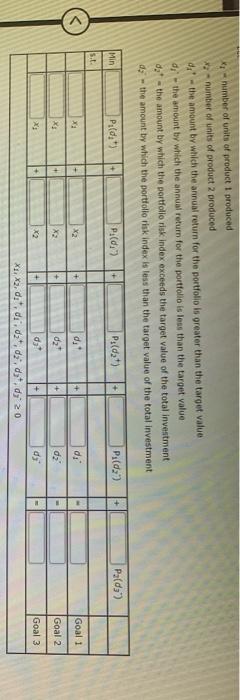
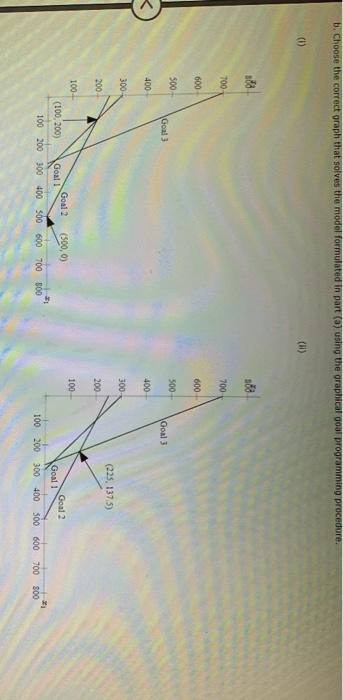
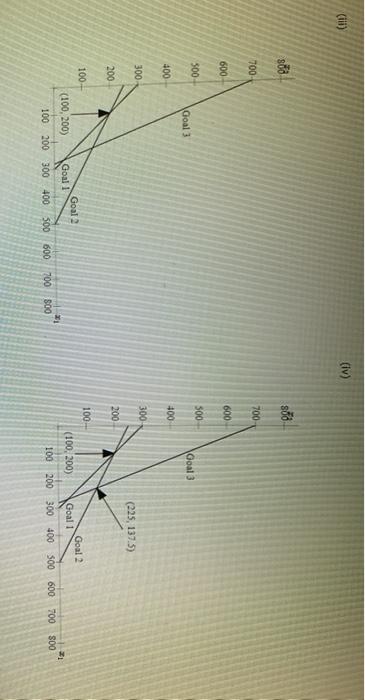
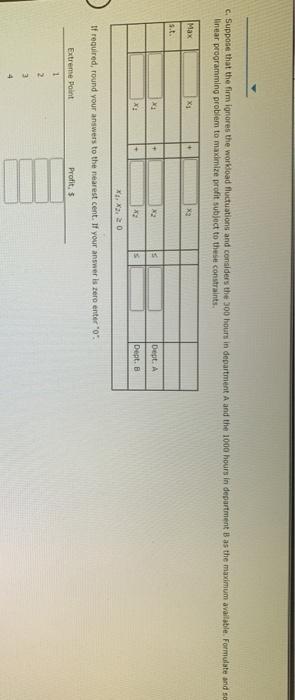
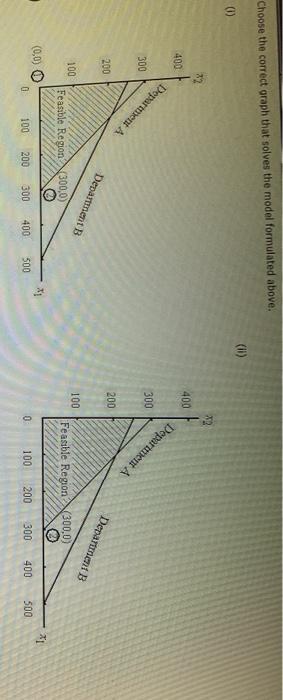
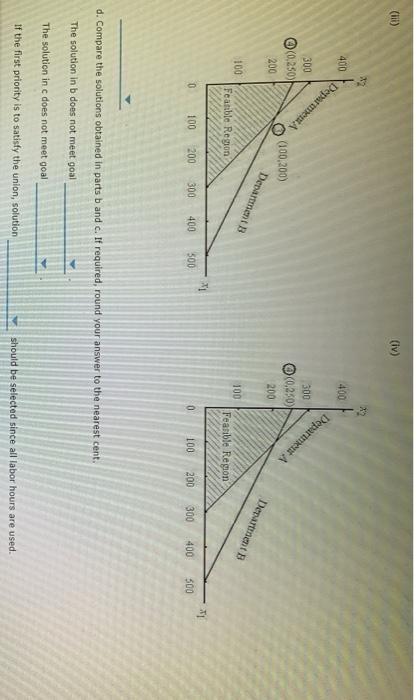
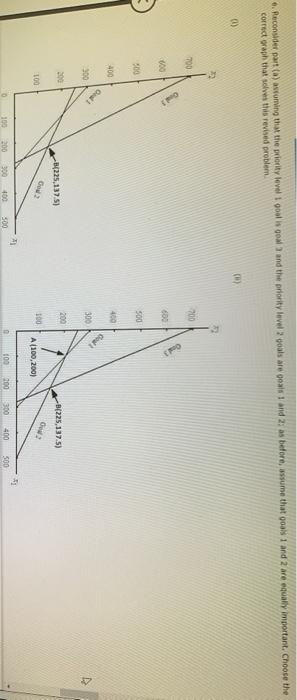
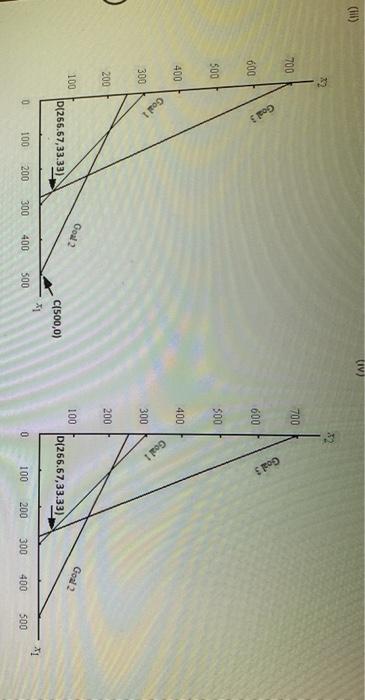
Problem 14-03 (Algorithmic) The L. Young & Sons Marvutacturing Company produces two products, which have the following profit and resource requirement characteristics: Characteristic Product 1 Product $2 Profit/unit 35 1 1 Dept. A houtsnit Dept. 8 hours/unit 2 4 Last month production schedule Used 300 hours of labor in department A and 1900 hours of labor in department Young's management has been experiencing workforce morate and labor union problems during the past six months because of monthly departmental workload fluctuations. New hirind, layoffs and interdepartmental transfers have been common because the firm has not attempted to stabilite workoadernet Management would to develop a production schedule for the coming month that will achieve the following goals Goal Use 300 hours at labor in deputat A. Go 2: UM 1000 hours of labor in department Goal 3: Eam a profit of at least 51400 a. Formulate a goal programming model for this problem, assuming that goals 1 and 2 are Pulevel goals and goal is a level goal: assume that goals 1 and 2 are equally important. If you don't need the variable in the model entero. If you need a negative number, enter min go with it Let * -number of units of product produced K-number of units of product 2 produced 4* - the amount by which the annual return for the portfolio is greater than the target value K-number of units of product produced number of units of product 2 produced dit - the amount by which the annual return for the portfolio is greater than the target value d; the amount by which the annual return for the portfolio is less than the target value dot - the amount by which the portfolio risk index exceeds the target value of the total investment ds - the amount by which the portfolio tisk index is less than the target value of the total investment Pild:) + P.(d) Min Pild:) Pa(da Pi(d) S.. X2 + d. d: Goal 1 X dz dz Goal 2 + Goal 3 X1, X3, dt. d.d. d.d. 20 b. Choose the correct graph that solves the model formulated in part (a) using the graphical goal programming procedure. (II) 188 700 700 600 600 500 500 Goal Goal 3 400 400 300 300 (225, 137.5) 200 200 100- 100 Goal 2 Goal 2 (500,0) (100, 200) Goal! 1 100 200 300 400 500 600 700 800 Goal 100 200 300 400 300 600 700 800 (iii) (lv) sod 888 700 700 600 600 300 500 Goal 3 Goal 3 400 400 300 300 (225, 137.5) 200 200 100- 100 Goal 2 Goal 1 (100, 200) Goal 2 Goal 1 (100, 200) 21 800 700 100 200 300 600 700 100 200 300 400 500 600 300 400 800 c. Suppose that the firm ignores the workload fluctuations and considers the 300 hours in department A and the 1000 hours in department B as the maximum available. Formulate and so linear programming problem to maximize profit subject to these constraints Max X X2 x 3 Dept. A Dept. B If required, round your answers to the nearest cent. If your answer is zero entero". Extreme Point Profit 1 2 MINI 3 4 Choose the correct graph that solves the model formulated above. 0 RE 400 400 Department A Department 300 300 200 200 Department B Department B 100 100 Feasible Region 300,0) Feasible Region (300.0 (0,0) 21 0 100 200 300 400 500 0 100 200 300 400 500 (iv) X2 400 400 Department A 300 (0,250) 200 (100,200) 300 00.250) 200 Departments Department 100 100 Featible Region Feasible Region 0 100 200 300 400 300 0 100 200 300 400 500 d. Compare the solutions obtained in parts b and c. If required, round your answer to the nearest cent. The solution in b does not meet goal The solution in c does not meet goal If the first priority is to satisfy the union, solution should be selected since all labor hours are used. Department d. Compare the solutions obtained in parts b and c. If required, round your answer to the nearest cent. The solution in b does not meet goal The solution in does not meet goal If the first priority is to satisfy the union, solution should be selected since all labor hours are used If the first priority is profit, solution should be selected as it results in 5 more profit than the alternative 6. Reconsider part(a) ascoming that the priority level tool is goal and the priority level goals are goals 1 and 2: as before, assume that goals 1 and 2 are equally important. Choose the correct graph that solves this revised problem () (0) 700 20 i 3 00 500 400 400 God 300 300 200 200 $225,137.5) (225,137.5) 100 Gou 2 100 A 100, 2001 100 200 300 400 300 100 200 300 400 500 (IV) 34 700 700 Goal Goals 600 3 600 500 500 400 400 Goal 1 Goal 1 300 300 2 200 200 Goal 2 Goal 2 100 100 D(265.67,33.33) D(266.67,33.33) C(500,0) 11 - X1 0 100 200 300 400 500 0 100 200 300 400 500 1. Compare your solution to the one obtained for the original problem. Round your answers to two dedeal places The solution to the revised problem is to produce hours This meet goal but goal by Problem 14-03 (Algorithmic) The L. Young & Sons Marvutacturing Company produces two products, which have the following profit and resource requirement characteristics: Characteristic Product 1 Product $2 Profit/unit 35 1 1 Dept. A houtsnit Dept. 8 hours/unit 2 4 Last month production schedule Used 300 hours of labor in department A and 1900 hours of labor in department Young's management has been experiencing workforce morate and labor union problems during the past six months because of monthly departmental workload fluctuations. New hirind, layoffs and interdepartmental transfers have been common because the firm has not attempted to stabilite workoadernet Management would to develop a production schedule for the coming month that will achieve the following goals Goal Use 300 hours at labor in deputat A. Go 2: UM 1000 hours of labor in department Goal 3: Eam a profit of at least 51400 a. Formulate a goal programming model for this problem, assuming that goals 1 and 2 are Pulevel goals and goal is a level goal: assume that goals 1 and 2 are equally important. If you don't need the variable in the model entero. If you need a negative number, enter min go with it Let * -number of units of product produced K-number of units of product 2 produced 4* - the amount by which the annual return for the portfolio is greater than the target value K-number of units of product produced number of units of product 2 produced dit - the amount by which the annual return for the portfolio is greater than the target value d; the amount by which the annual return for the portfolio is less than the target value dot - the amount by which the portfolio risk index exceeds the target value of the total investment ds - the amount by which the portfolio tisk index is less than the target value of the total investment Pild:) + P.(d) Min Pild:) Pa(da Pi(d) S.. X2 + d. d: Goal 1 X dz dz Goal 2 + Goal 3 X1, X3, dt. d.d. d.d. 20 b. Choose the correct graph that solves the model formulated in part (a) using the graphical goal programming procedure. (II) 188 700 700 600 600 500 500 Goal Goal 3 400 400 300 300 (225, 137.5) 200 200 100- 100 Goal 2 Goal 2 (500,0) (100, 200) Goal! 1 100 200 300 400 500 600 700 800 Goal 100 200 300 400 300 600 700 800 (iii) (lv) sod 888 700 700 600 600 300 500 Goal 3 Goal 3 400 400 300 300 (225, 137.5) 200 200 100- 100 Goal 2 Goal 1 (100, 200) Goal 2 Goal 1 (100, 200) 21 800 700 100 200 300 600 700 100 200 300 400 500 600 300 400 800 c. Suppose that the firm ignores the workload fluctuations and considers the 300 hours in department A and the 1000 hours in department B as the maximum available. Formulate and so linear programming problem to maximize profit subject to these constraints Max X X2 x 3 Dept. A Dept. B If required, round your answers to the nearest cent. If your answer is zero entero". Extreme Point Profit 1 2 MINI 3 4 Choose the correct graph that solves the model formulated above. 0 RE 400 400 Department A Department 300 300 200 200 Department B Department B 100 100 Feasible Region 300,0) Feasible Region (300.0 (0,0) 21 0 100 200 300 400 500 0 100 200 300 400 500 (iv) X2 400 400 Department A 300 (0,250) 200 (100,200) 300 00.250) 200 Departments Department 100 100 Featible Region Feasible Region 0 100 200 300 400 300 0 100 200 300 400 500 d. Compare the solutions obtained in parts b and c. If required, round your answer to the nearest cent. The solution in b does not meet goal The solution in c does not meet goal If the first priority is to satisfy the union, solution should be selected since all labor hours are used. Department d. Compare the solutions obtained in parts b and c. If required, round your answer to the nearest cent. The solution in b does not meet goal The solution in does not meet goal If the first priority is to satisfy the union, solution should be selected since all labor hours are used If the first priority is profit, solution should be selected as it results in 5 more profit than the alternative 6. Reconsider part(a) ascoming that the priority level tool is goal and the priority level goals are goals 1 and 2: as before, assume that goals 1 and 2 are equally important. Choose the correct graph that solves this revised problem () (0) 700 20 i 3 00 500 400 400 God 300 300 200 200 $225,137.5) (225,137.5) 100 Gou 2 100 A 100, 2001 100 200 300 400 300 100 200 300 400 500 (IV) 34 700 700 Goal Goals 600 3 600 500 500 400 400 Goal 1 Goal 1 300 300 2 200 200 Goal 2 Goal 2 100 100 D(265.67,33.33) D(266.67,33.33) C(500,0) 11 - X1 0 100 200 300 400 500 0 100 200 300 400 500 1. Compare your solution to the one obtained for the original problem. Round your answers to two dedeal places The solution to the revised problem is to produce hours This meet goal but goal by