

Question: Problem 15-09 With the gasoline time series data from the given table, show the exponential smoothing forecasts using = 0.1. Applying the MSE measure of
Problem 15-09
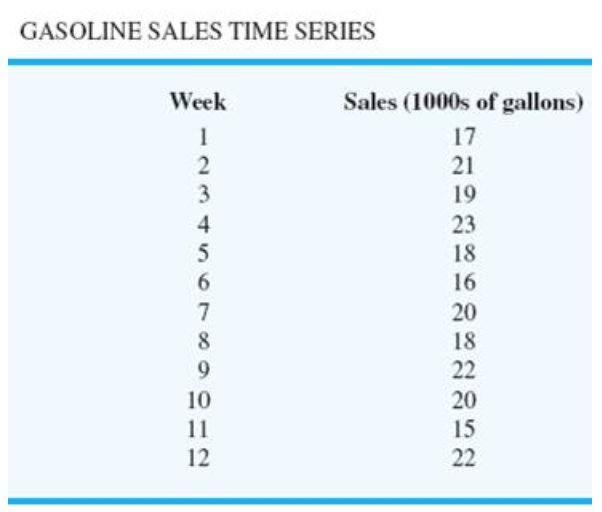
With the gasoline time series data from the given table, show the exponential smoothing forecasts using = 0.1.
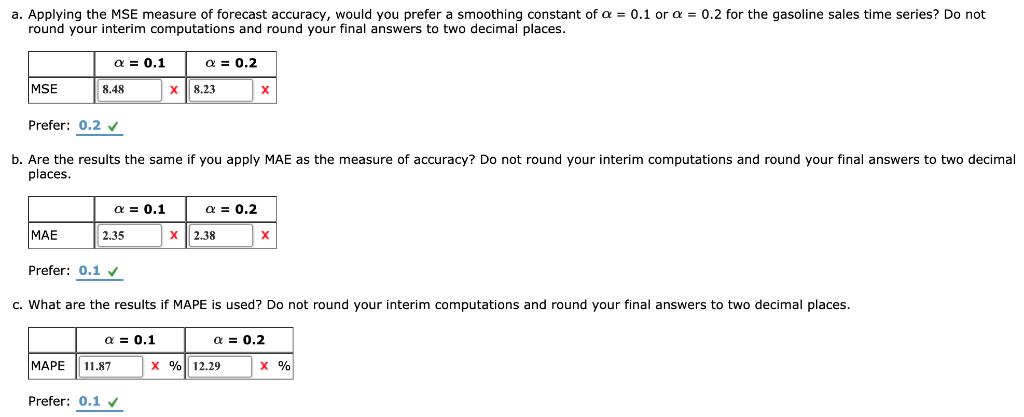
- Applying the MSE measure of forecast accuracy, would you prefer a smoothing constant of = 0.1 or = 0.2 for the gasoline sales time series? Do not round your interim computations and round your final answers to two decimal places.
Prefer: 0.2= 0.1 = 0.2 MSE - Are the results the same if you apply MAE as the measure of accuracy? Do not round your interim computations and round your final answers to two decimal places.
Prefer: 0.1= 0.1 = 0.2 MAE - What are the results if MAPE is used? Do not round your interim computations and round your final answers to two decimal places.
Prefer: 0.1= 0.1 = 0.2 MAPE % %
GASOLINE SALES TIME SERIES Sales (1000s of gallons) Week 17 21 19 23 5 18 6 16 7 20 18 9 22 20 10 15 11 12 22 23 a. Applying the MSE measure of forecast accuracy, would you prefer a smoothing constant of a 0.1 or a = 0.2 for the gasoline sales time series? Do not round your interim computations and round your final answers to two decimal places a 0.2 a 0.1 MSE 8.48 8.23 X Prefer: 0.2 b. Are the results the same if you apply MAE as the measure of accuracy? Do not round your interim computations and round your final answers to two decimal places 0.1 0.2 MAE 2.35 X 2.38 X Prefer: 0.1 v c. What are the results if MAPE is used? Do not round your interim computations and round your final answers to two decimal places a 0.2 a 0.1 MAPE X %12.29 11.87 Prefer: 0.1
Step by Step Solution
There are 3 Steps involved in it

Get step-by-step solutions from verified subject matter experts