

Question: Problem 16-41 Net Present Value; Total-Cost Approach (Section 1) (LO 16-1, 16-3) The chief ranger of the states Department of Natural Resources is considering a
Problem 16-41 Net Present Value; Total-Cost Approach (Section 1) (LO 16-1, 16-3)
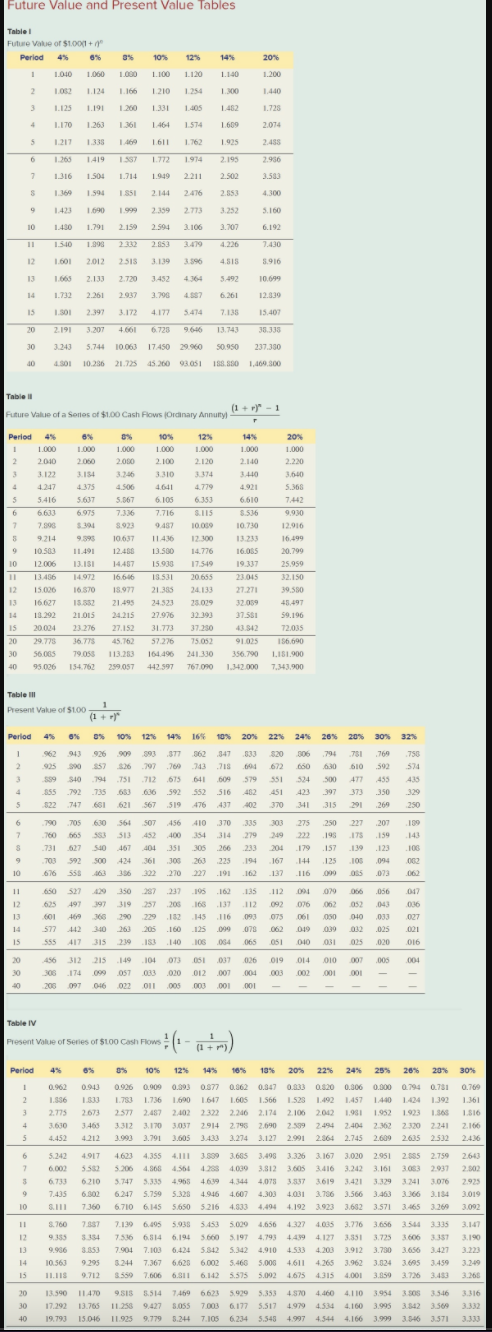
The chief ranger of the states Department of Natural Resources is considering a new plan for fighting forest fires in the states forest lands. The current plan uses eight fire-control stations, which are scattered throughout the interior of the state forest. Each station has a four-person staff, whose annual compensation totals $320,000. Other costs of operating each base amount to $220,000 per year. The equipment at each base has a current salvage value of $240,000. The buildings at these interior stations have no other use. To demolish them would cost $22,000 each. The chief ranger is considering an alternative plan, which involves four fire-control stations located on the perimeter of the state forest. Each station would require a six-person staff, with annual compensation costs of $420,000. Other operating costs would be $230,000 per base. Building each perimeter station would cost $320,000. The perimeter bases would need helicopters and other equipment costing $620,000 per station. Half of the equipment from the interior stations could be used at the perimeter stations. Therefore, only half of the equipment at the interior stations would be sold if the perimeter stations were built. The state uses a 10 percent hurdle rate for all capital projects. Use Appendix A for your reference. (Use appropriate factor(s) from the tables provided.)
 Required: 1. Use the total-cost approach to prepare a net-present-value analysis of the chief rangers two fire-control plans. (Assume that the interior fire-control stations will be demolished if the perimeter plan is selected. The chief ranger has decided to use a 10-year time period for the analysis.) (Round your "Discount factors" to 3 decimal places. Negative amounts should be indicated by a minus sign.)
| |||||||||
Future Value and Present Value Tables Table 1 Future Value of $1001+ Period 3% 10% 12% 14% 20% 1 1.010 1.060 1.000 1.100 1.120 1.140 1.200 2 1.02 1.124 1.166 1.210 1254 1.00 1.440 3 1.125 1.191 1.200 1.331 1405 1.482 1.728 4 1.170 1.263 1.361 1464 1.574 1.609 2.074 5 1217 1.338 1.469 1.611 1762 1.925 2.455 6 1.760 1.419 1.537 1.772 1974 2.195 2.936 2 1.316 1.500 1.714 1.949 2211 2.502 3.500 1.594 1 SSI 2.144 2.476 2.553 4.300 9 1.690 1.999 2.359 2.773 3.252 5.160 10 1.430 1.791 2.159 2.594 3.106 3.707 6.192 11 1.30 1.998 2332 2.353 31419 4.226 7.430 12 1.601 2012 75 3.1.39 3596 4.518 5.916 13 2.133 2.720 3.452 4.64 5.492 10.6499 1.732 2.261 3.790 4.587 6.261 12.330 15 1.301 2.397 4.177 5474 7.135 15.407 20 2.191 3.207 4661 6.725 9646 13.743 38.338 30 3.243 5.744 10.063 17.450 29.960 50 950 237.350 40 10.286 21.725 45.200 93.051 158.850 1.469.800 Table i (1 + r)" - 1 Future Value of a series of $1.00 Cash Flows Ordinary Annuity! Period 4% 6% 8% 10% 12% 14% 20% 1 1.000 1.000 1.000 1.000 1.000 2 2010 2010 2.000 2.100 2.120 2.140 2.220 3 3.122 3.154 3.246 3.310 3.410 3.500 4 4.247 4375 4.506 4641 4.921 5.368 5 5.416 5.637 5.567 6.105 6.353 7.442 6.610 3536 6 6.633 6.975 7.336 7.716 S.115 9.930 7 7.898 $30 8.923 9457 10.000 10.730 12.910 5 9.214 9.59 10.6.37 12.300 13.233 16,499 9 10.503 11.491 12.450 13.500 14.776 16.055 20.799 10 12.006 13.18 14457 15900 17.549 19337 25.959 11 13.456 1492 16.66 13.531 20.655 23.015 32.150 15.026 16 570 18.97 24.133 27.271 39.580 21.335 24.523 13 16.627 15.52 21.495 25.029 32.059 4.97 14 13.292 21.01 24.215 27.976 32.393 37.551 59.196 15 20.024 23.27 27.152 31.773 37.250 43.842 72,035 20 29.775 36.71 45.762 57.276 75.052 91025 156.690 30 56.005 79.05 113.25 164.496 241.330 356.790 151.900 40 95.026 154.762 259,057 442 597 767.00 1.342.000 7,141,000 Table Present Value of $100 1 (+ (1 + 1 Period 4 4% 6% 10% 12% 14% 16 10% 20% 22% 24% 26% 20% 30% 32 1 943 926 900 $90 377 63 347 533 3120 794 751 769 750 2 925 $90 557 5:26 293 264 743 718 .601 622 660 .630 610 .592 574 3 599 540 794 751 712 675 641.609.579 551 524 500 47 455 435 4 355 792 785 650 636 592 552 516 482 451 423 397 373 .350 329 5 322 .747 661 621 567 .519476 437 402 370 341 .315 291 250 6 790 705 630 564 507 456 410 370 335 03 275 250 227 .207 109 7 160 565 550 513 452 400 354 279 222 198 175 159 143 S 731 527 540 167 404 .351 305 .266 .233 24 179 157 139 .123 100 703 592 500 424 361 305 263 225 194 167 144 125 105 094 002 10 676 270 .191 162 137 116 .073 002 11 650 527 350 27 237 195 .162 .135 112 094079 06 .056 017 12 625 197 197 257 200 165 137 112 092 076 062 052 043 036 13 601 69 2902 152 145 116 093 07 061050 040 033 027 14 572 12 140 160 125 .099 .079 062 019 0.39 02 .025 021 15 555 417 315 210 IS 140 106 064 065 051 010 031 025 020 016 20 312 215 104.073 037 026 019 014 010 00 005 004 30 306 174 099 057 033 .020 012 007 .004 003 002 ,001 001 206 097 046 022 011005 003 001 001 Table IV Present Value of Series of $100 Cash Flows ( (1-1) (1 + ) Period 3% 10% 124 14% 18% 13 20% 22% 24% 25% 20% 20% 30% 1 0.962 0.943 0.926 0.909 0.9930877 0.362 0.347 0.833 0.820 0.306 0.000 0.794 0.781 0.769 2 1.536 1.300 1.780 1.736 1.500 1667 1.605 1.566 1.528 1.492 1.457 1440 1434 1392 1.361 3 2.775 2673 2577 2.457 2.4022322 2.246 2.174 2.100 2012 1931 1.952 1933 1.366 1.516 4 3.630 3.463 3.312 3.170 3,037 2914 2.795 2.690 2.509 2.494 2.404 2.362 2320 2.241 2.166 5 4.452 4212 3.993 3.791 3.605 3.433 3.274 3.127 2.991 22364 2.745 2.609 2635 2.532 2.4.36 6 5.242 4917 4.623 4.355 4.11 3.685 3.498 3.326 3.167 3.020 2.951 285 2750 2.643 7 6.000 3332 4.566 4,030 3.812 3.605 3.416 3.242 3.161 3.083 2.937 2.502 3 6.733 6210 3.747 5.335 4.908 4619 4144 4,073 1129 1741 3.070 2.925 3.837 3619 3.421 400 3.756 3.566 9 7.435 6.302 6.247 5.759 5.328 4.946 4.607 303 3.463 3.366 3.134 3.019 10 SINI 7360 6710 6.145 5.6505216 4.333 4,494 4.192 3.9233.682 3.571 3.465 3.269 3.092 11 8.760 7.887 7.139 6.195 5.935 3.453 5.000 4,656 4327 4.035 3.776 3.656 3.544335 3.147 12 9335 3354 7.536 6.814 6.19 5660 5.197 4.793 44.994.12 4.127 3.351 3.725 3606 357 3.190 13 3.853 7.904 7.103 6.424 5.542 5.3424.910 4.533 4.200 3.912 3.700 3.656 3.427 14 10.563 9.295 324 7.367 6,625 6.002 5.466 5.003 4611 4.265 3.962 3.024 3.695 3.459 3.2.49 15 11.11 9.712 3.550 7.606 6.11 6.142 5.575 5.092 4.675 4.315 4.000 3.859 3.726 3.453 3.265 20 13.590 11470 8.514 7.469 66 6623 5.919 5.353 +370 4.400 4.110 3.954 3.05 3.546 3.316 30 17.292 13.765 9.427 BOSS 7.003 6.177 5.517 4.979 4.534 4.100 3.995 3.342 3.569 3.332 40 19.793 15.046 11.925 9,779 5.244 7100 6,234 5.548 +997 4.544 4.166 3.999 3.546 3571 3.333 Future Value and Present Value Tables Table 1 Future Value of $1001+ Period 3% 10% 12% 14% 20% 1 1.010 1.060 1.000 1.100 1.120 1.140 1.200 2 1.02 1.124 1.166 1.210 1254 1.00 1.440 3 1.125 1.191 1.200 1.331 1405 1.482 1.728 4 1.170 1.263 1.361 1464 1.574 1.609 2.074 5 1217 1.338 1.469 1.611 1762 1.925 2.455 6 1.760 1.419 1.537 1.772 1974 2.195 2.936 2 1.316 1.500 1.714 1.949 2211 2.502 3.500 1.594 1 SSI 2.144 2.476 2.553 4.300 9 1.690 1.999 2.359 2.773 3.252 5.160 10 1.430 1.791 2.159 2.594 3.106 3.707 6.192 11 1.30 1.998 2332 2.353 31419 4.226 7.430 12 1.601 2012 75 3.1.39 3596 4.518 5.916 13 2.133 2.720 3.452 4.64 5.492 10.6499 1.732 2.261 3.790 4.587 6.261 12.330 15 1.301 2.397 4.177 5474 7.135 15.407 20 2.191 3.207 4661 6.725 9646 13.743 38.338 30 3.243 5.744 10.063 17.450 29.960 50 950 237.350 40 10.286 21.725 45.200 93.051 158.850 1.469.800 Table i (1 + r)" - 1 Future Value of a series of $1.00 Cash Flows Ordinary Annuity! Period 4% 6% 8% 10% 12% 14% 20% 1 1.000 1.000 1.000 1.000 1.000 2 2010 2010 2.000 2.100 2.120 2.140 2.220 3 3.122 3.154 3.246 3.310 3.410 3.500 4 4.247 4375 4.506 4641 4.921 5.368 5 5.416 5.637 5.567 6.105 6.353 7.442 6.610 3536 6 6.633 6.975 7.336 7.716 S.115 9.930 7 7.898 $30 8.923 9457 10.000 10.730 12.910 5 9.214 9.59 10.6.37 12.300 13.233 16,499 9 10.503 11.491 12.450 13.500 14.776 16.055 20.799 10 12.006 13.18 14457 15900 17.549 19337 25.959 11 13.456 1492 16.66 13.531 20.655 23.015 32.150 15.026 16 570 18.97 24.133 27.271 39.580 21.335 24.523 13 16.627 15.52 21.495 25.029 32.059 4.97 14 13.292 21.01 24.215 27.976 32.393 37.551 59.196 15 20.024 23.27 27.152 31.773 37.250 43.842 72,035 20 29.775 36.71 45.762 57.276 75.052 91025 156.690 30 56.005 79.05 113.25 164.496 241.330 356.790 151.900 40 95.026 154.762 259,057 442 597 767.00 1.342.000 7,141,000 Table Present Value of $100 1 (+ (1 + 1 Period 4 4% 6% 10% 12% 14% 16 10% 20% 22% 24% 26% 20% 30% 32 1 943 926 900 $90 377 63 347 533 3120 794 751 769 750 2 925 $90 557 5:26 293 264 743 718 .601 622 660 .630 610 .592 574 3 599 540 794 751 712 675 641.609.579 551 524 500 47 455 435 4 355 792 785 650 636 592 552 516 482 451 423 397 373 .350 329 5 322 .747 661 621 567 .519476 437 402 370 341 .315 291 250 6 790 705 630 564 507 456 410 370 335 03 275 250 227 .207 109 7 160 565 550 513 452 400 354 279 222 198 175 159 143 S 731 527 540 167 404 .351 305 .266 .233 24 179 157 139 .123 100 703 592 500 424 361 305 263 225 194 167 144 125 105 094 002 10 676 270 .191 162 137 116 .073 002 11 650 527 350 27 237 195 .162 .135 112 094079 06 .056 017 12 625 197 197 257 200 165 137 112 092 076 062 052 043 036 13 601 69 2902 152 145 116 093 07 061050 040 033 027 14 572 12 140 160 125 .099 .079 062 019 0.39 02 .025 021 15 555 417 315 210 IS 140 106 064 065 051 010 031 025 020 016 20 312 215 104.073 037 026 019 014 010 00 005 004 30 306 174 099 057 033 .020 012 007 .004 003 002 ,001 001 206 097 046 022 011005 003 001 001 Table IV Present Value of Series of $100 Cash Flows ( (1-1) (1 + ) Period 3% 10% 124 14% 18% 13 20% 22% 24% 25% 20% 20% 30% 1 0.962 0.943 0.926 0.909 0.9930877 0.362 0.347 0.833 0.820 0.306 0.000 0.794 0.781 0.769 2 1.536 1.300 1.780 1.736 1.500 1667 1.605 1.566 1.528 1.492 1.457 1440 1434 1392 1.361 3 2.775 2673 2577 2.457 2.4022322 2.246 2.174 2.100 2012 1931 1.952 1933 1.366 1.516 4 3.630 3.463 3.312 3.170 3,037 2914 2.795 2.690 2.509 2.494 2.404 2.362 2320 2.241 2.166 5 4.452 4212 3.993 3.791 3.605 3.433 3.274 3.127 2.991 22364 2.745 2.609 2635 2.532 2.4.36 6 5.242 4917 4.623 4.355 4.11 3.685 3.498 3.326 3.167 3.020 2.951 285 2750 2.643 7 6.000 3332 4.566 4,030 3.812 3.605 3.416 3.242 3.161 3.083 2.937 2.502 3 6.733 6210 3.747 5.335 4.908 4619 4144 4,073 1129 1741 3.070 2.925 3.837 3619 3.421 400 3.756 3.566 9 7.435 6.302 6.247 5.759 5.328 4.946 4.607 303 3.463 3.366 3.134 3.019 10 SINI 7360 6710 6.145 5.6505216 4.333 4,494 4.192 3.9233.682 3.571 3.465 3.269 3.092 11 8.760 7.887 7.139 6.195 5.935 3.453 5.000 4,656 4327 4.035 3.776 3.656 3.544335 3.147 12 9335 3354 7.536 6.814 6.19 5660 5.197 4.793 44.994.12 4.127 3.351 3.725 3606 357 3.190 13 3.853 7.904 7.103 6.424 5.542 5.3424.910 4.533 4.200 3.912 3.700 3.656 3.427 14 10.563 9.295 324 7.367 6,625 6.002 5.466 5.003 4611 4.265 3.962 3.024 3.695 3.459 3.2.49 15 11.11 9.712 3.550 7.606 6.11 6.142 5.575 5.092 4.675 4.315 4.000 3.859 3.726 3.453 3.265 20 13.590 11470 8.514 7.469 66 6623 5.919 5.353 +370 4.400 4.110 3.954 3.05 3.546 3.316 30 17.292 13.765 9.427 BOSS 7.003 6.177 5.517 4.979 4.534 4.100 3.995 3.342 3.569 3.332 40 19.793 15.046 11.925 9,779 5.244 7100 6,234 5.548 +997 4.544 4.166 3.999 3.546 3571 3.333
Step by Step Solution
There are 3 Steps involved in it

Get step-by-step solutions from verified subject matter experts