

Question: problem 16.7 for reference everything is given already what other information do you need??? *18.4. Refer to Productivity improvement Problem 16.7. a. Prepare aligned residual
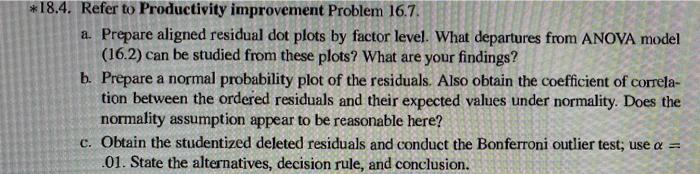
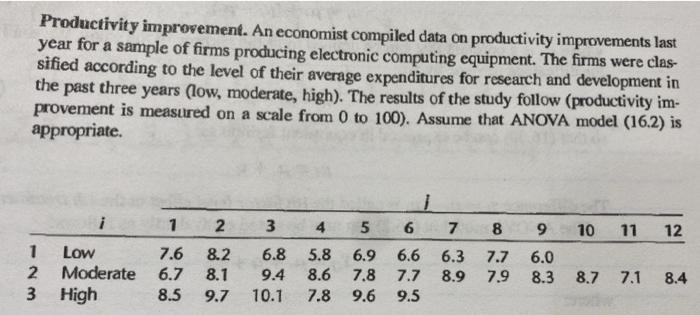
*18.4. Refer to Productivity improvement Problem 16.7. a. Prepare aligned residual dot plots by factor level. What departures from ANOVA model (16.2) can be studied from these plots? What are your findings? b. Prepare a normal probability plot of the residuals. Also obtain the coefficient of correla- tion between the ordered residuals and their expected values under normality. Does the normality assumption appear to be reasonable here? c. Obtain the studentized deleted residuals and conduct the Bonferroni outlier test; use a = .01. State the alternatives, decision rule, and conclusion. Productivity improvement. An economist compiled data on productivity improvements last year for a sample of firms producing electronic computing equipment. The firms were clas- sified according to the level of their average expenditures for research and development in the past three years (low, moderate, high). The results of the study follow (productivity im- provement is measured on a scale from 0 to 100). Assume that ANOVA model (16.2) is appropriate. i 1 6 1 2 3 4 5 7 8 9 10 11 12 1 Low 2 Moderate 3 High 7.6 6.7 8.5 8.2 6.8 8.1 9.4 9.7 10.1 5.8 6.9 6.6 6.3 8.6 7.8 7.7 8.9 7.8 9.6 9.5 7.7 7.9 6.0 8.3 8.7 7.1 8.4 *18.4. Refer to Productivity improvement Problem 16.7. a. Prepare aligned residual dot plots by factor level. What departures from ANOVA model (16.2) can be studied from these plots? What are your findings? b. Prepare a normal probability plot of the residuals. Also obtain the coefficient of correla- tion between the ordered residuals and their expected values under normality. Does the normality assumption appear to be reasonable here? c. Obtain the studentized deleted residuals and conduct the Bonferroni outlier test; use a = .01. State the alternatives, decision rule, and conclusion. Productivity improvement. An economist compiled data on productivity improvements last year for a sample of firms producing electronic computing equipment. The firms were clas- sified according to the level of their average expenditures for research and development in the past three years (low, moderate, high). The results of the study follow (productivity im- provement is measured on a scale from 0 to 100). Assume that ANOVA model (16.2) is appropriate. i 1 6 1 2 3 4 5 7 8 9 10 11 12 1 Low 2 Moderate 3 High 7.6 6.7 8.5 8.2 6.8 8.1 9.4 9.7 10.1 5.8 6.9 6.6 6.3 8.6 7.8 7.7 8.9 7.8 9.6 9.5 7.7 7.9 6.0 8.3 8.7 7.1 8.4
Step by Step Solution
There are 3 Steps involved in it

Get step-by-step solutions from verified subject matter experts