

Question: Problem 17-2A Ratios, common-size statements, and trend percents LO P1, P2, P3 [The following information applies to the questions displayed below. Selected comparative financial statements
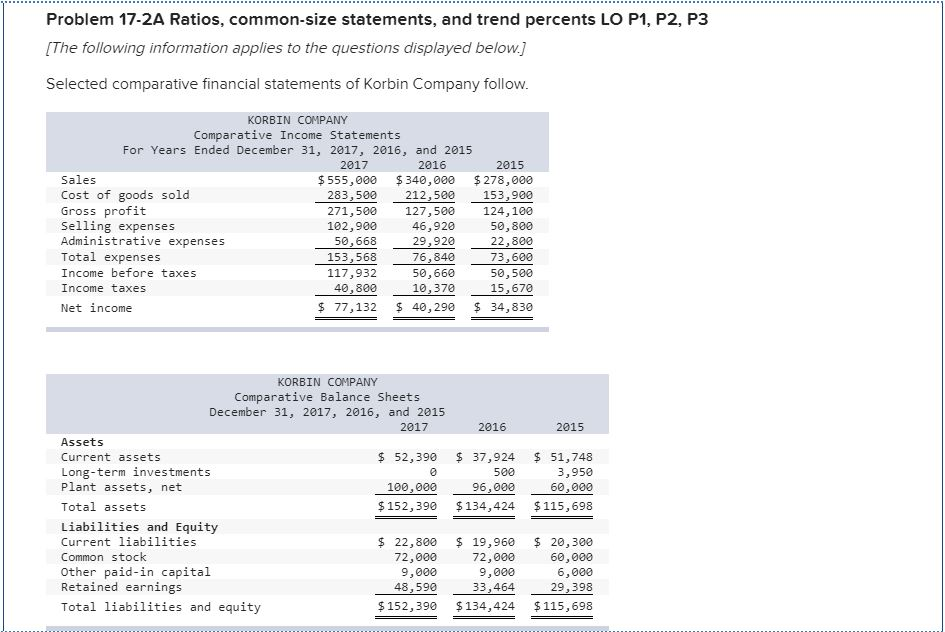
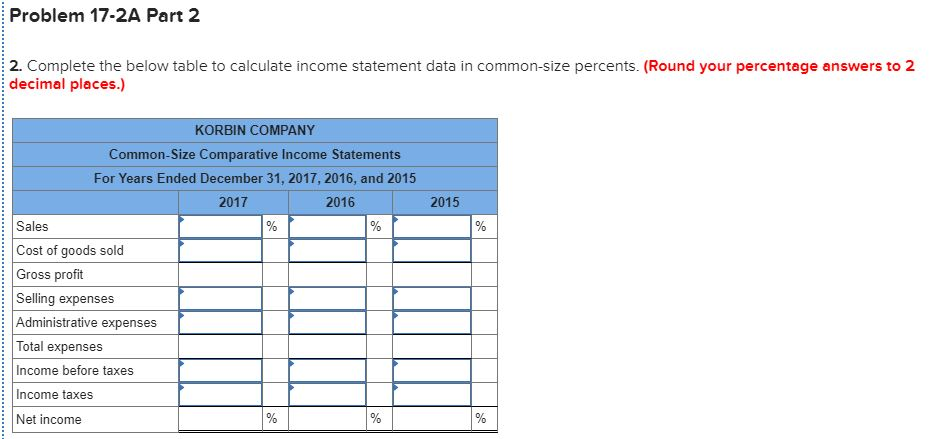
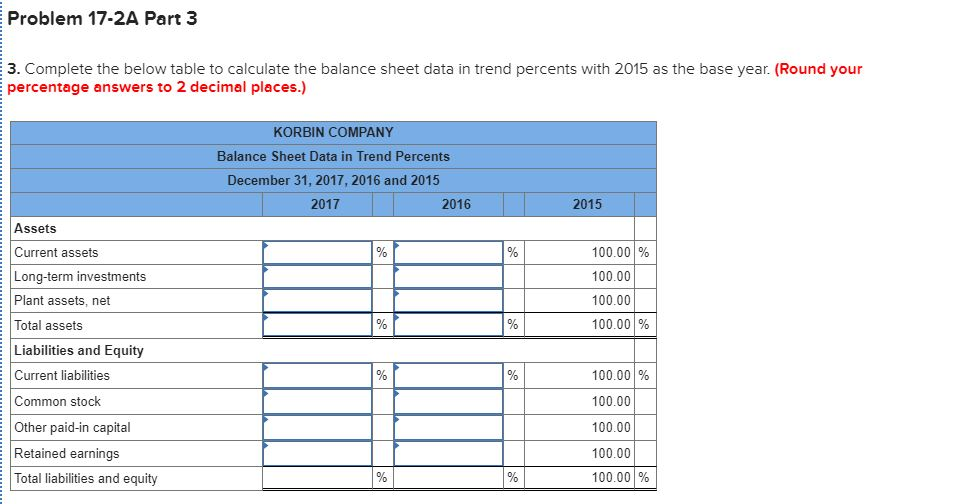
Problem 17-2A Ratios, common-size statements, and trend percents LO P1, P2, P3 [The following information applies to the questions displayed below. Selected comparative financial statements of Korbin Company follow KORBIN COMPANY Comparative Income Statements For Years Ended December 31, 2017, 2016, and 2015 2017 2016 2015 Sales Cost of goods sold Gross profit Selling expenses Administrative expenses Total expenses Income before taxes Income taxes $. 555,000 $340,000 278,000 153,900 124,100 50,800 22,800 73,600 50,500 15,670 $ 77,132 40,290 34,830 283,500 271,500 102,900 50,668 153,568 117,932 40,800 212,500 127, 500 46,920 29,920 76,840 50,660 10,370 Net income KORBIN COMPANY Comparative Balance Sheets December 31, 2017, 2016, and 2015 2017 2016 2015 AssetS Current assets Long-term investments Plant assets, net Total assets $ 52,390 37,924 51,748 3,950 100,00096,00068,860 500 $152, 390 134,424 $115,698 Liabilities and Equity Current liabilities Common stock Other paid-in capital Retained earnings $ 22,800 19,960 20,300 60,000 6,000 29,398 $152,390 134,424 115,698 72,000 9,000 72,000 9,000 48,590 3334O Total liabilities and equity Problem 17-2A Part 2 2. Complete the below table to calculate income statement data in common-size percents. (Round your percentage answers to 2 decimal places.) KORBIN COMPANY Common-Size Comparative Income Statements For Years Ended December 31, 2017, 2016, and 2015 2017 2016 2015 Sales Cost of goods sold Gross profit Selling expenses Administrative expenses Total expenses Income before taxes Income taxes Net income Problem 17-2A Part 3 3. Complete the below table to calculate the balance sheet data in trend percents with 2015 as the base year. (Round your percentage answers to 2 decimal places.) KORBIN COMPANY Balance Sheet Data in Trend Percents December 31, 2017, 2016 and 2015 2017 2016 2015 Assets Current assets Long-term investments Plant assets, net Total assets Liabilities and Equity Current liabilities Common stock Other paid-in capital Retained earnings Total liabilities and equity 100.00% 100.00 100.00 100.001% 100.00% 100.00 100.00 100.00 100.00 %
Step by Step Solution
There are 3 Steps involved in it

Get step-by-step solutions from verified subject matter experts