

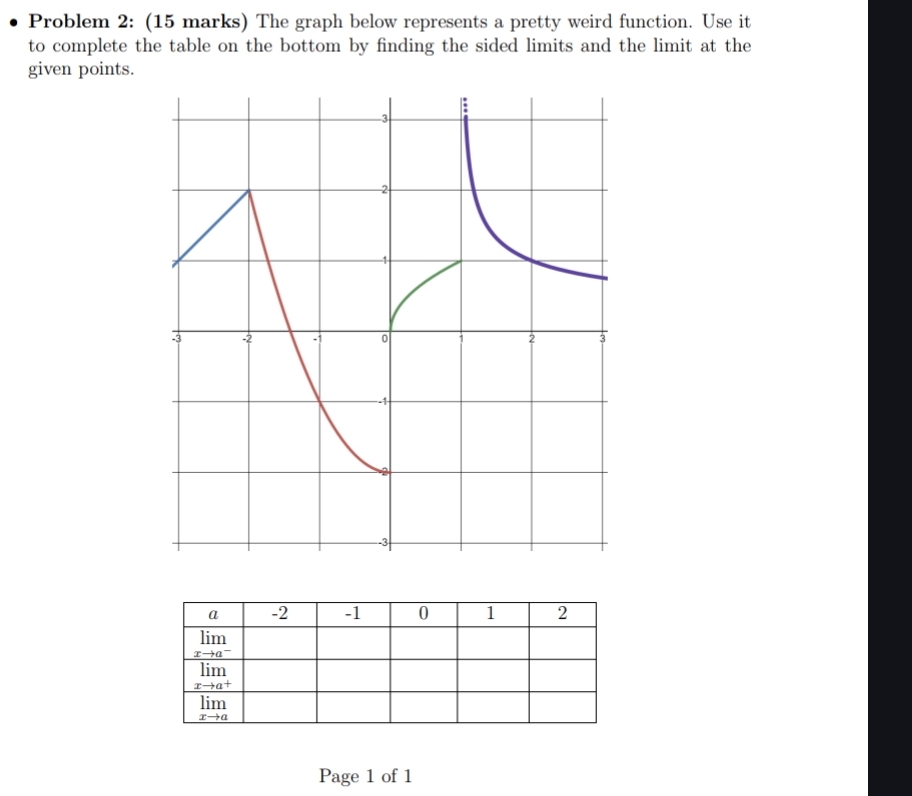
Question: Problem 2 : ( 1 5 marks ) The graph below represents a pretty weird function. Use it to complete the table on the bottom
Problem : marks The graph below represents a pretty weird function. Use it to complete the table on the bottom by finding the sided limits and the limit at the given points.
table
Page of
Step by Step Solution
There are 3 Steps involved in it
1 Expert Approved Answer
Step: 1 Unlock

Question Has Been Solved by an Expert!
Get step-by-step solutions from verified subject matter experts
Step: 2 Unlock
Step: 3 Unlock