

Question: Problem 2 ( 1 7 pts ) Figure below is a histogram which describes hourly rainfall for a 5 - hour storm. ur Each block
Problem pts
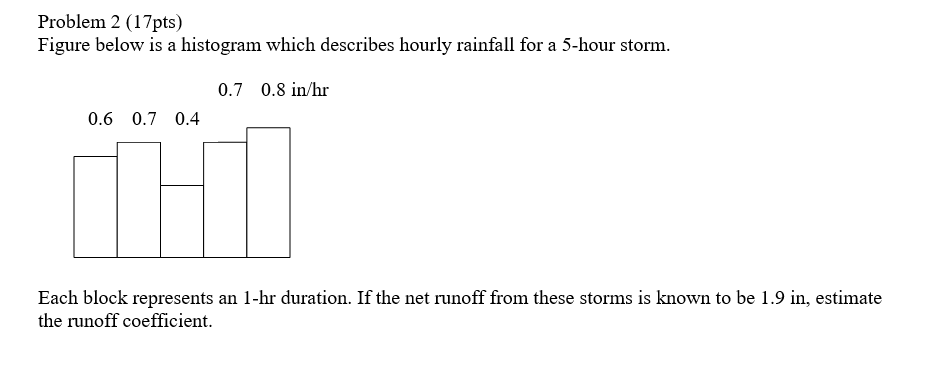
Figure below is a histogram which describes hourly rainfall for a hour storm.
ur
Each block represents an hr duration. If the net runoff from these storms is known to be in estimate
the runoff coefficient.
Step by Step Solution
There are 3 Steps involved in it
1 Expert Approved Answer
Step: 1 Unlock

Question Has Been Solved by an Expert!
Get step-by-step solutions from verified subject matter experts
Step: 2 Unlock
Step: 3 Unlock