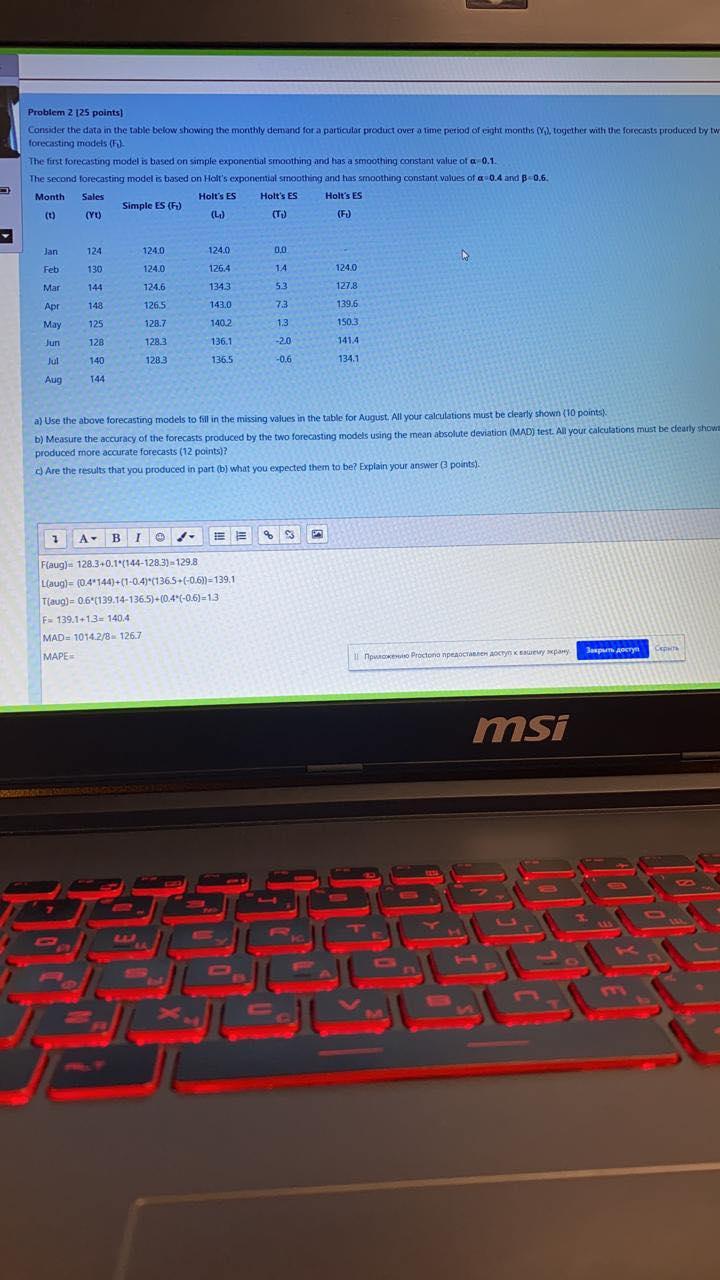
Question: Problem 2 125 points) Consider the data in the table below showing the monthly demand for a particular product over a time period of eight

Problem 2 125 points) Consider the data in the

Problem 2 125 points) Consider the data in the table below showing the monthly demand for a particular product over a time period of eight months Y.) together with the forecasts produced by tw forecasting models (F. The first forecasting model is based on simple exponential smoothing and has a smoothing constant value of a 0.1. The second forecasting model is based on Holt's exponential smoothing and has smoothing constant values of a 0.4 and B-0.6. Month Sales Holt's ES Holt's ES Holt's ES Simple ES () (0) (YU) (L) (TO) (F) Jan 124 124.0 124.0 0.0 Feb 130 126.4 14 124.0 124.0 124.6 Mar 144 1343 127.8 53 73 Apr 148 126.5 143.0 139.6 May 125 128.7 140.2 1.3 150.3 141.4 Jun 128 128.2 136,1 -20 Jul 140 128.3 135.5 -0.6 134.1 Aug T44 a) Use the above forecasting models to fill in the missing values in the table for August. All your calculations must be clearly shown (10 points) b) Measure the accuracy of the forecasts produced by the two forecasting models using the mean absolute deviation (MAD) test. All your calculations must be clearly show produced more accurate forecasts (12 points)? c) Are the results that you produced in part (b) what you expected them to be? Explain your answer points) 7 AB I- % $3 Flaug) 128.340.1(144-128.3) 129.8 Laug)= (0.4'144)+(1-0.4)(1365 (-0.6)=139.1 Taug)= 0.6 (139.14-136,5)-(0.4C-0.6) -13 F-139.1+13= 140.4 MAD= 10142/81267 MAPE II Proctorno msi

Step by Step Solution

There are 3 Steps involved in it

1 Expert Approved Answer
Step: 1 Unlock blur-text-image
Question Has Been Solved by an Expert!

Get step-by-step solutions from verified subject matter experts

Step: 2 Unlock
Step: 3 Unlock

Students Have Also Explored These Related General Management Questions!