

Question: Problem 2 (20 points) The table attached represents engineering investments with i*s (-64%, 10%, 15%). Draw the cash flow diagrams and then use the Net
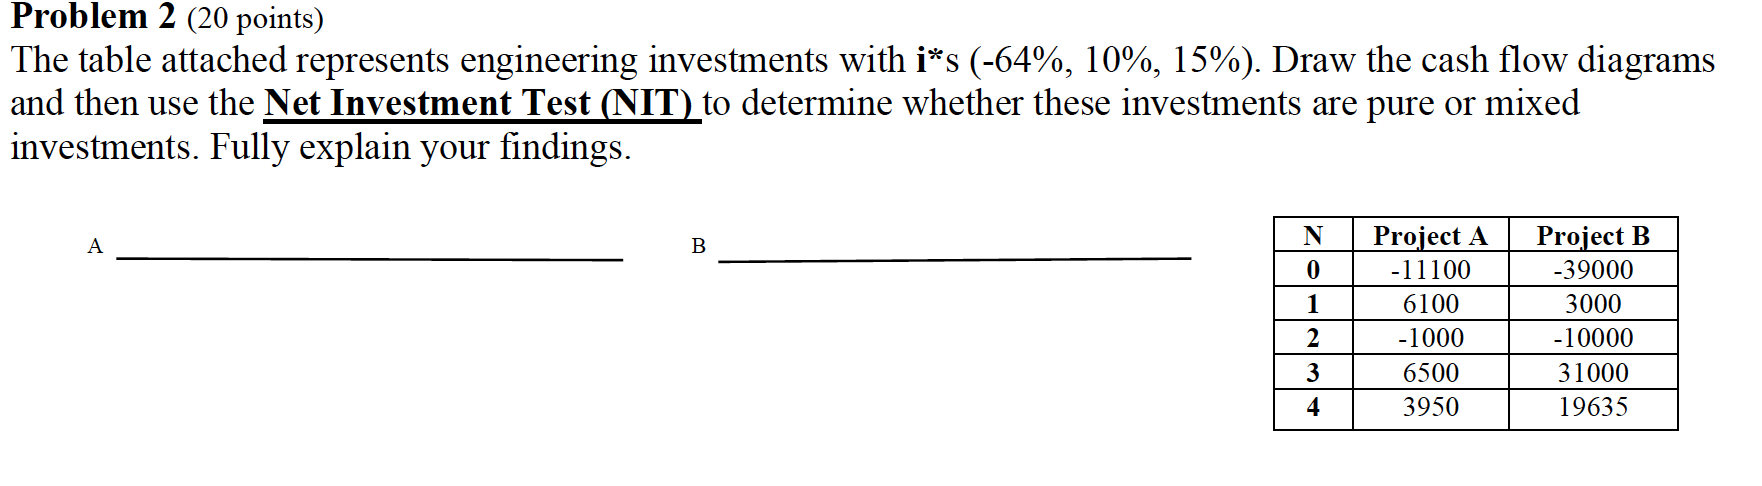
Problem 2 (20 points) The table attached represents engineering investments with i*s (-64%, 10%, 15%). Draw the cash flow diagrams and then use the Net Investment Test (NIT) to determine whether these investments are pure or mixed investments. Fully explain your findings. N A B 0 1 Project A -11100 6100 -1000 6500 3950 Project B -39000 3000 -10000 31000 19635 2 3 4 Problem 2 (20 points) The table attached represents engineering investments with i*s (-64%, 10%, 15%). Draw the cash flow diagrams and then use the Net Investment Test (NIT) to determine whether these investments are pure or mixed investments. Fully explain your findings. N A B 0 1 Project A -11100 6100 -1000 6500 3950 Project B -39000 3000 -10000 31000 19635 2 3 4
Step by Step Solution
There are 3 Steps involved in it

Get step-by-step solutions from verified subject matter experts