

Question: Problem 2 . 3 : Table 2 . 5 contains a summary of local speed data for 1 7 2 vehicles observed during normal days.
Problem :
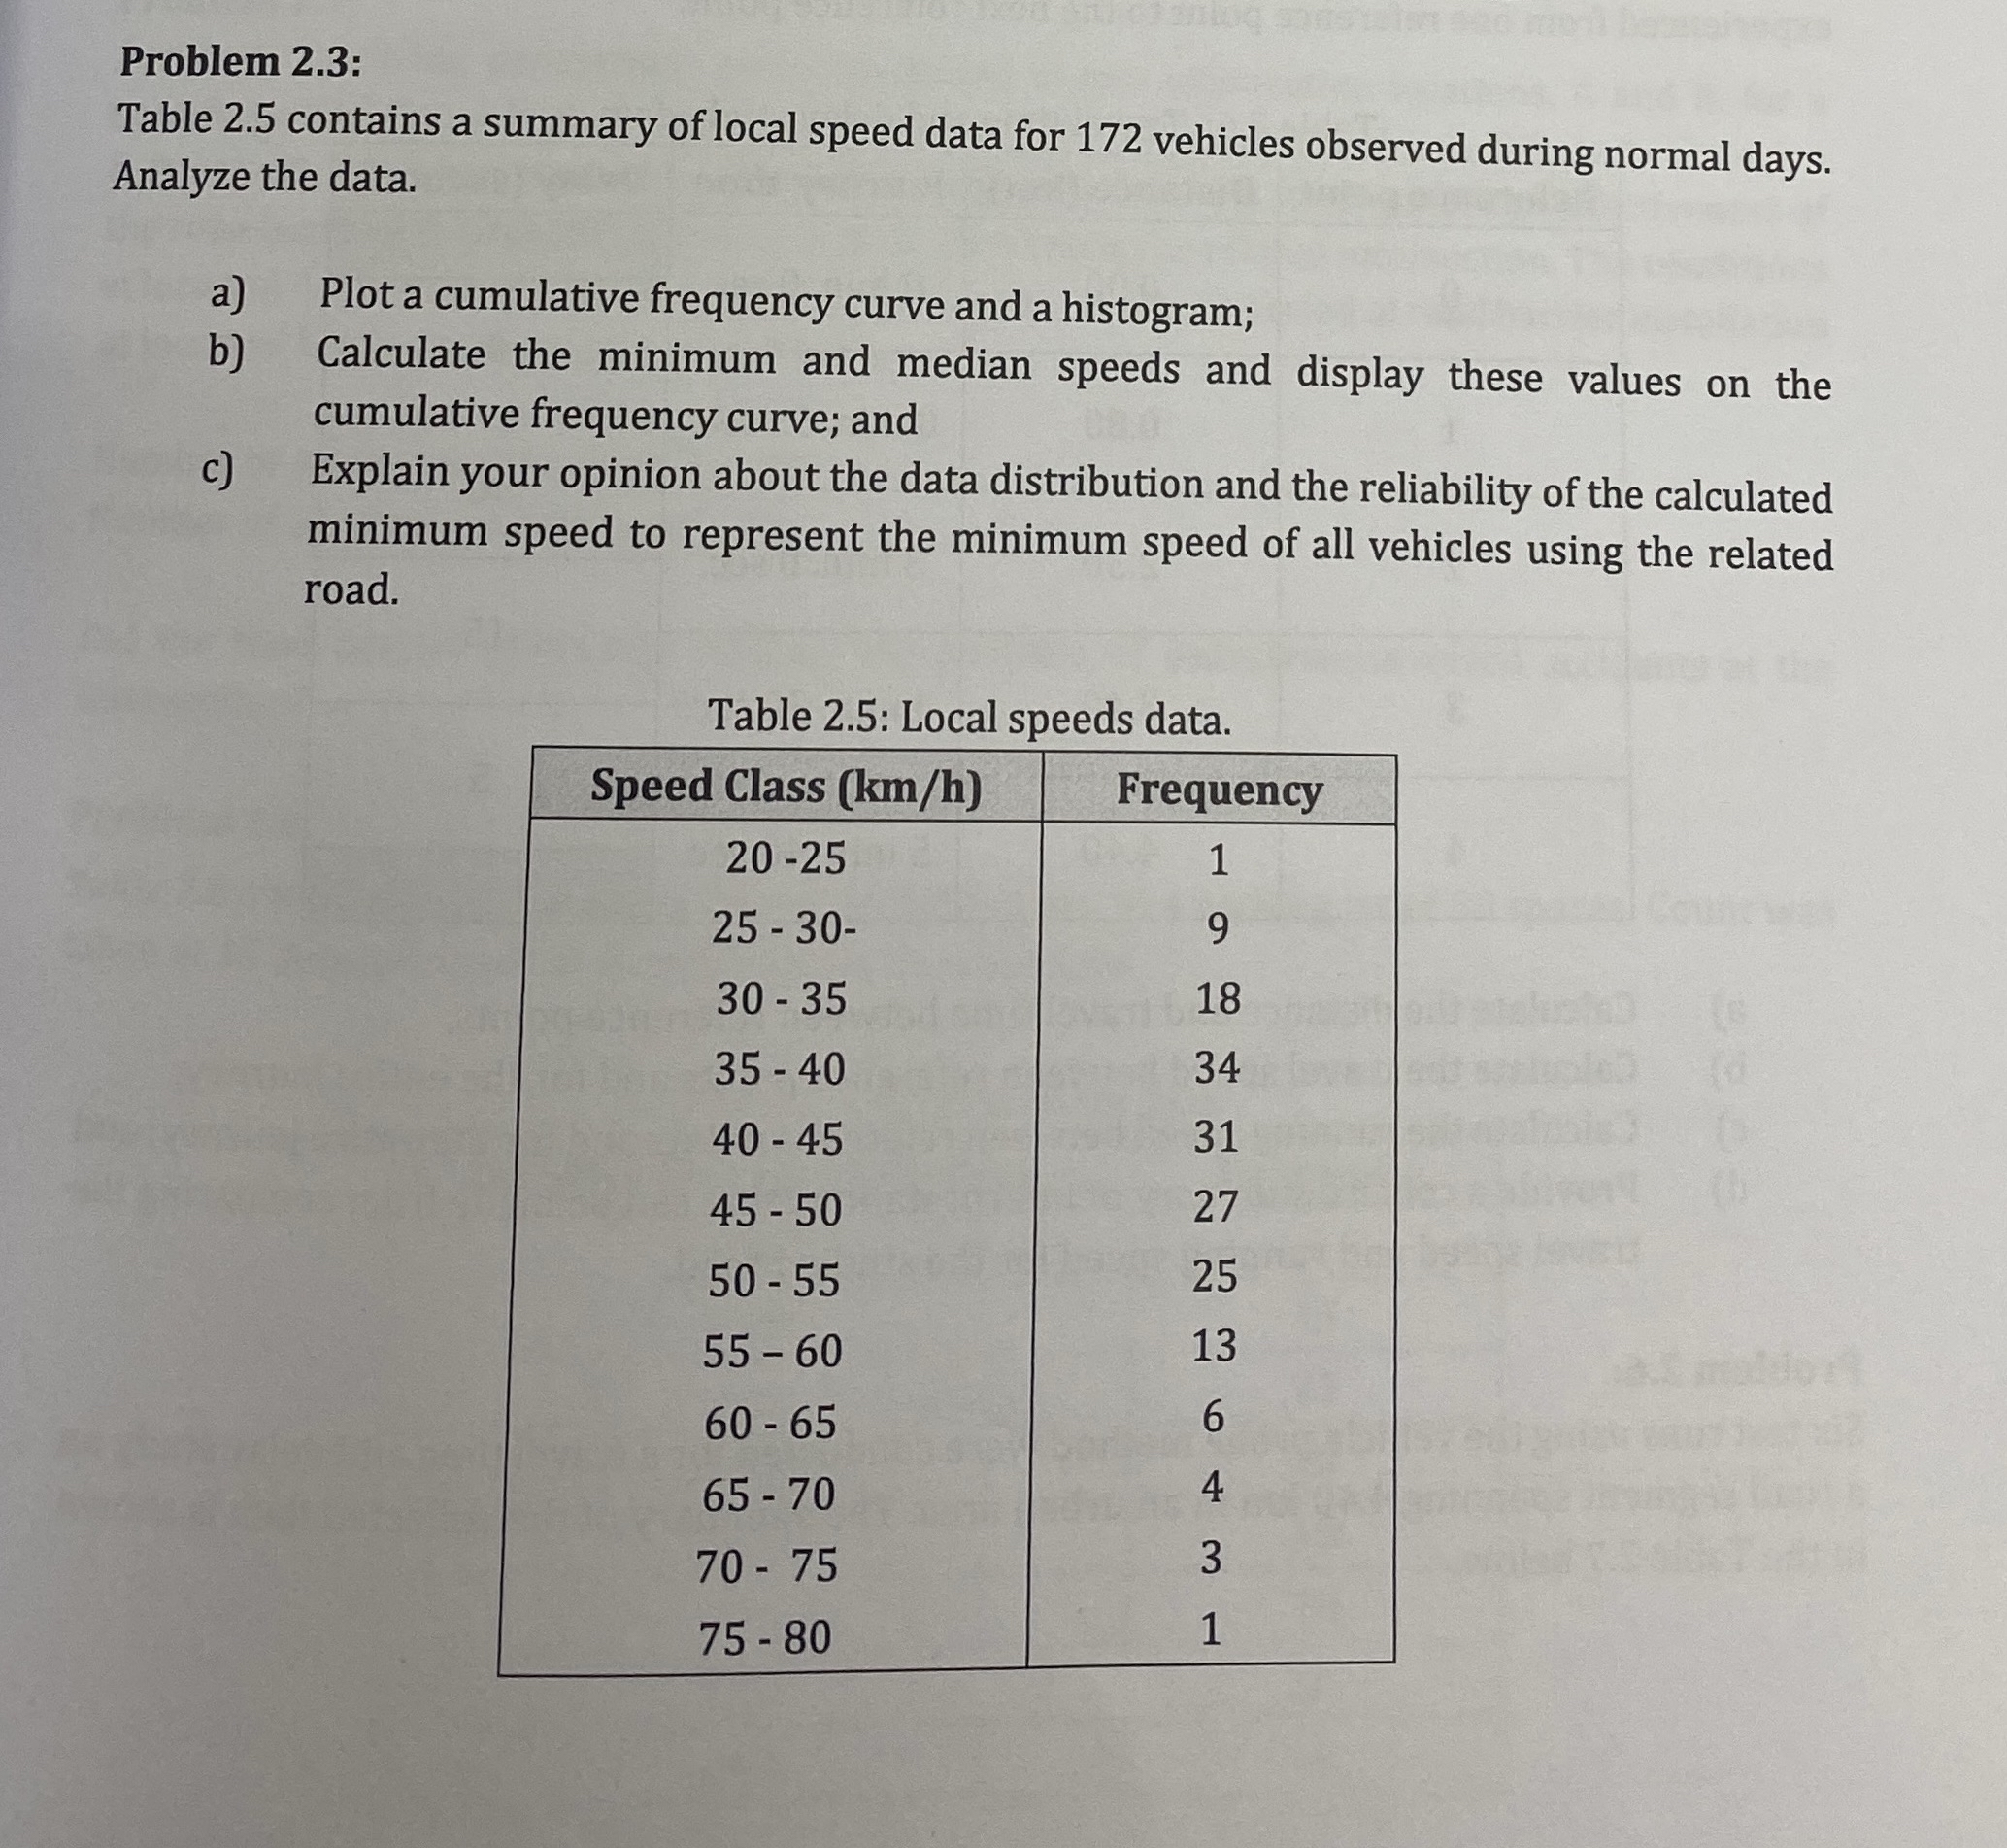
Table contains a summary of local speed data for vehicles observed during normal days. Analyze the data.
a Plot a cumulative frequency curve and a histogram;
b Calculate the minimum and median speeds and display these values on the cumulative frequency curve; and
c Explain your opinion about the data distribution and the reliability of the calculated minimum speed to represent the minimum speed of all vehicles using the related road.
Table : Local speeds data.
tableSpeed Class kmhFrequency
Step by Step Solution
There are 3 Steps involved in it
1 Expert Approved Answer
Step: 1 Unlock

Question Has Been Solved by an Expert!
Get step-by-step solutions from verified subject matter experts
Step: 2 Unlock
Step: 3 Unlock