

Question: Problem 2 ( 4 0 ) For a given laboratory data from a 1 D consolidation test, a . Calculate C v , for the
Problem
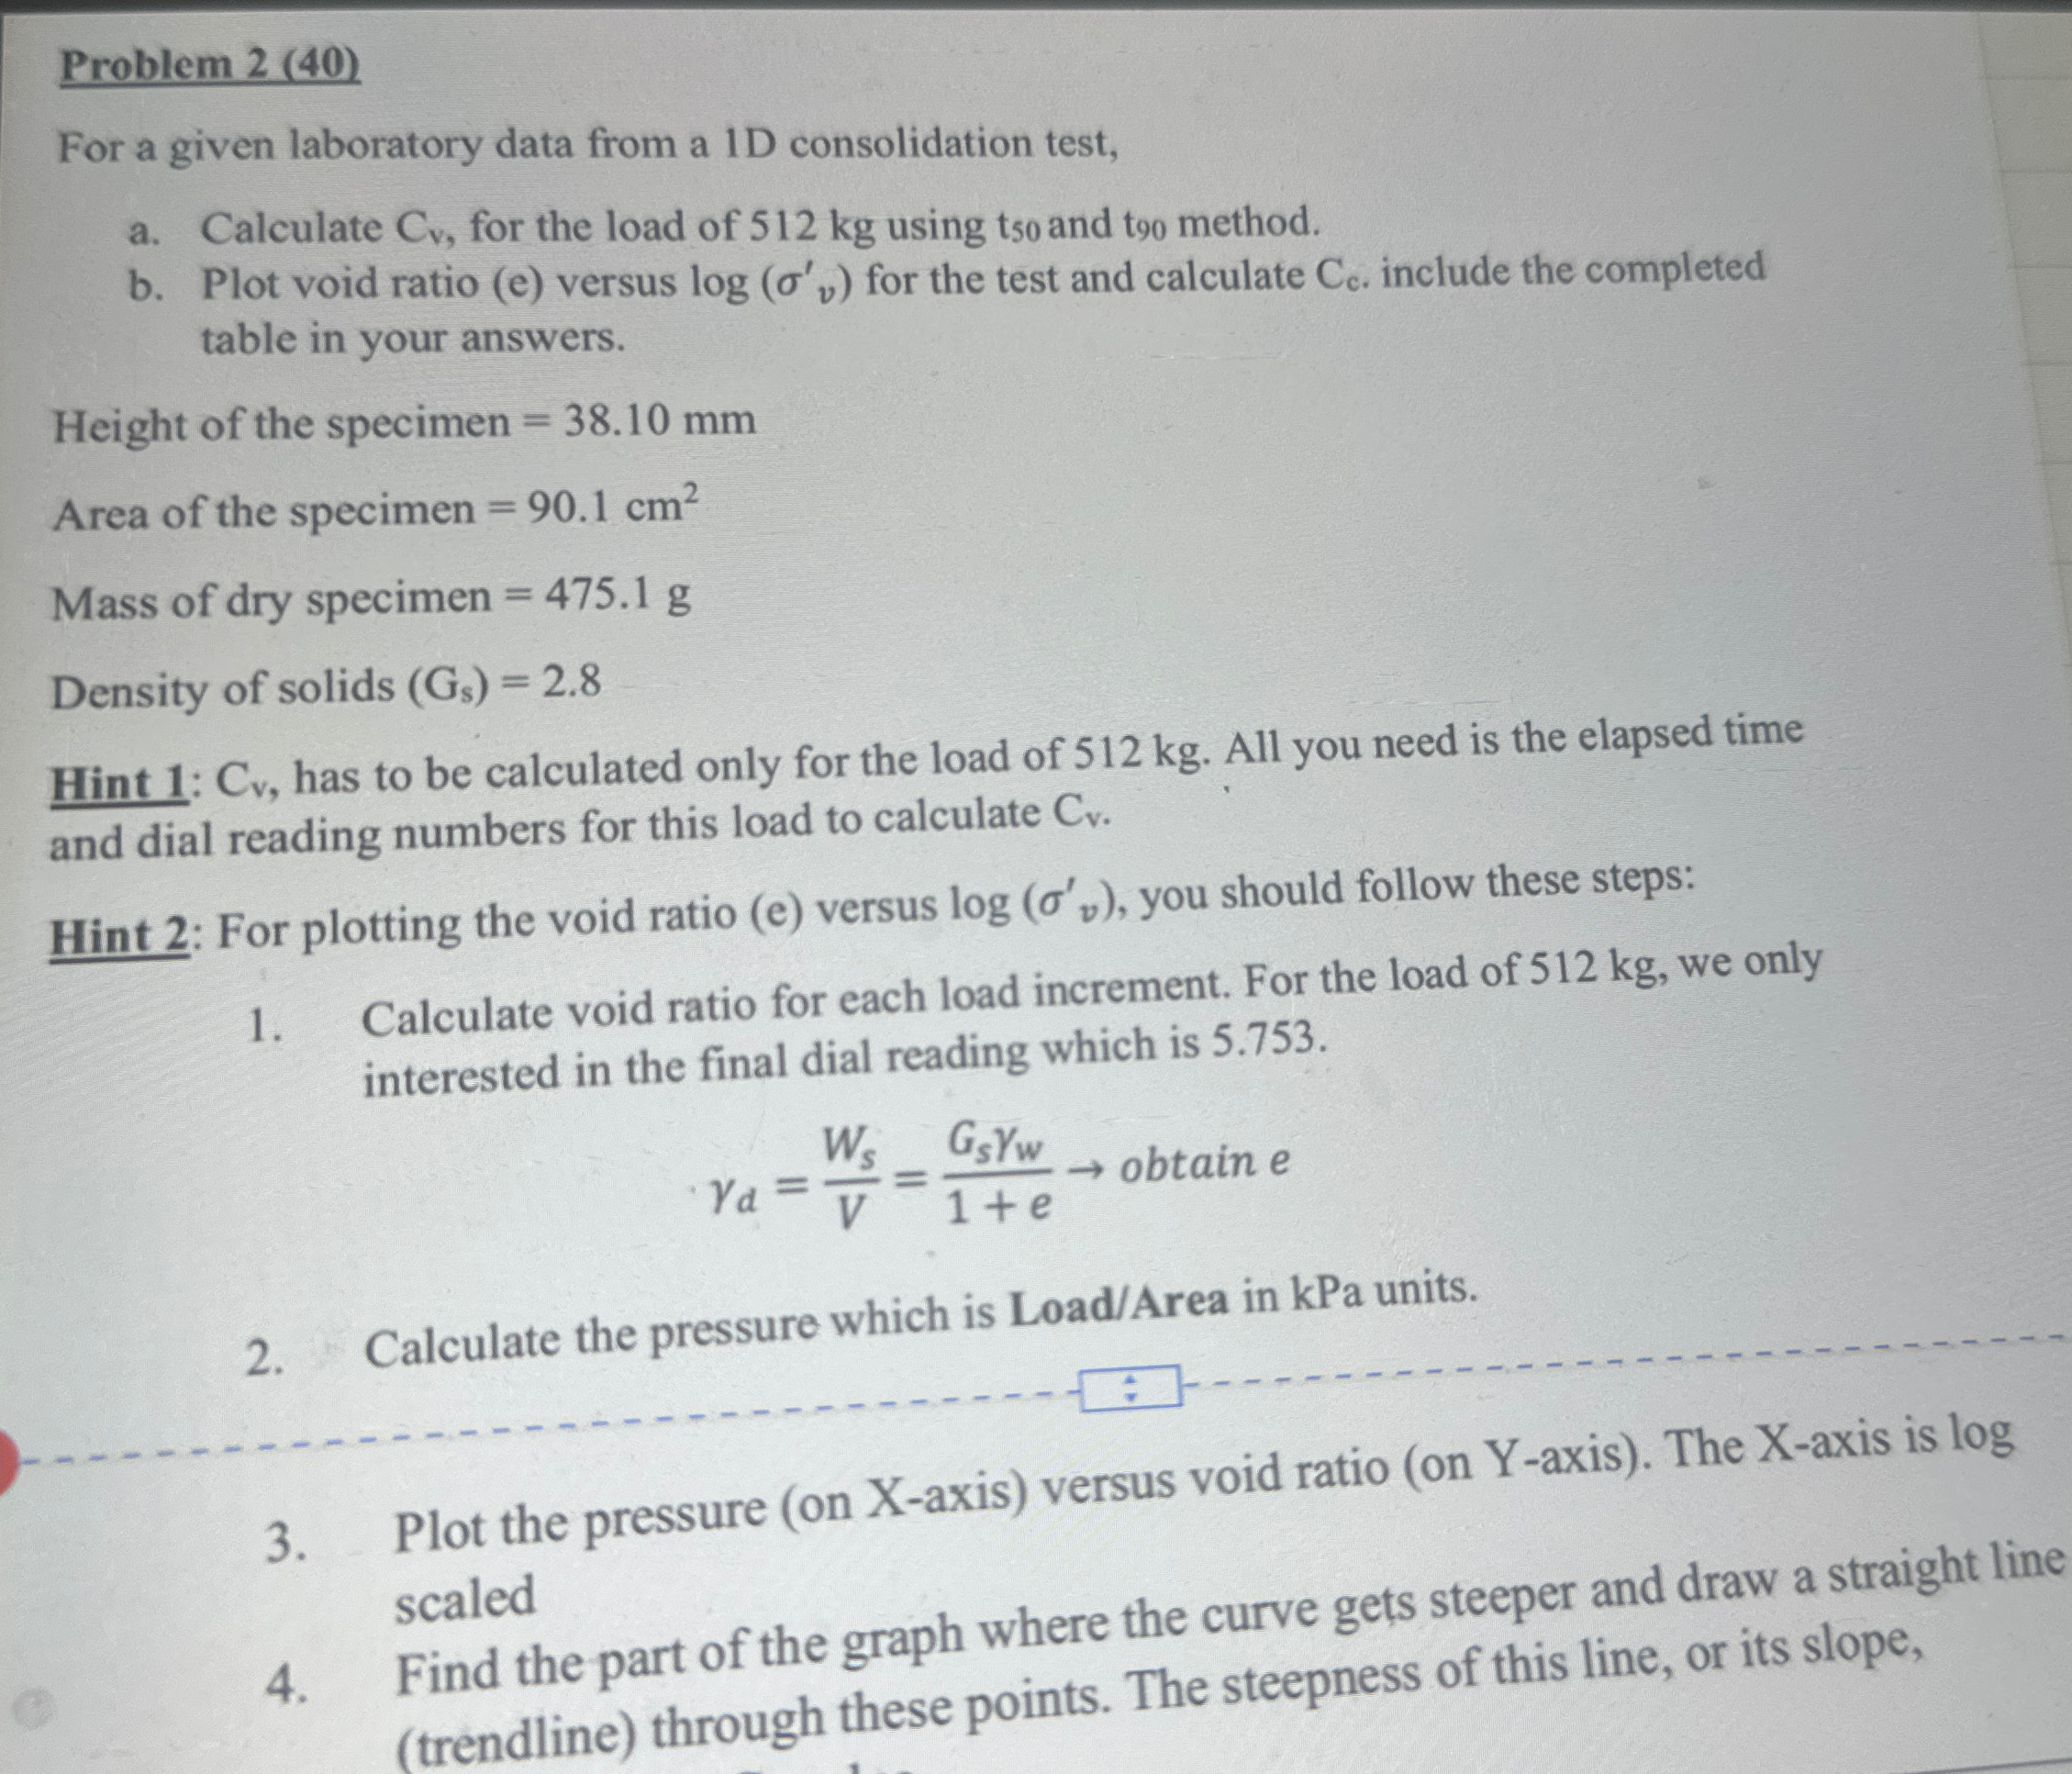
For a given laboratory data from a D consolidation test,
a Calculate for the load of using and t method.
b Plot void ratio e versus for the test and calculate include the completed table in your answers.
Height of the specimen
Area of the specimen
Mass of dry specimen
Density of solids
Hint : has to be calculated only for the load of All you need is the elapsed time and dial reading numbers for this load to calculate
Hint : For plotting the void ratio e versus you should follow these steps:
Calculate void ratio for each load increment. For the load of we only interested in the final dial reading which is
obtain
Calculate the pressure which is LoadArea in kPa units.
Plot the pressure on Xaxis versus void ratio on Yaxis The Xaxis is log scaled
Find the part of the graph where the curve gets steeper and draw a straight line trendline through these points. The steepness of this line, or its slope,
Step by Step Solution
There are 3 Steps involved in it
1 Expert Approved Answer
Step: 1 Unlock

Question Has Been Solved by an Expert!
Get step-by-step solutions from verified subject matter experts
Step: 2 Unlock
Step: 3 Unlock