

Question: Problem 2. (40 points) Historical data of the returns for Goodman and Landry is given in the table below. 2013 2012 2011 2010 2009 Goodman
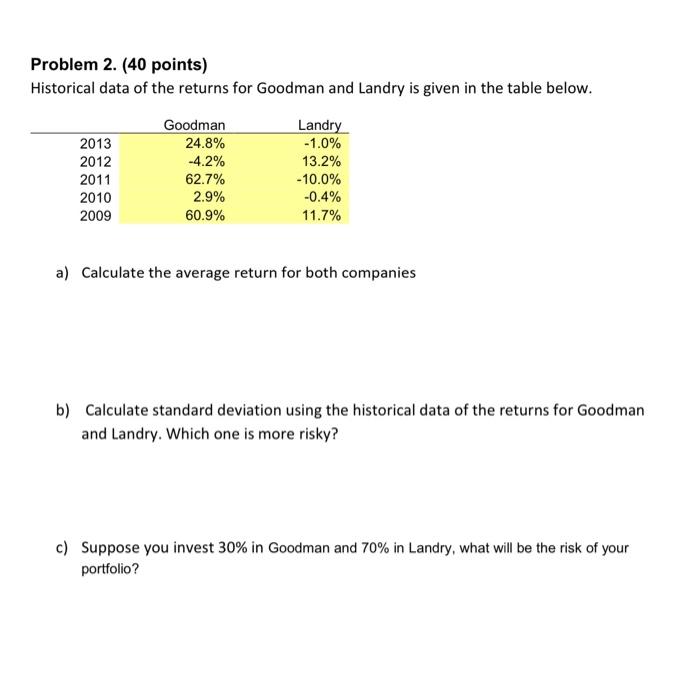
Problem 2. (40 points) Historical data of the returns for Goodman and Landry is given in the table below. 2013 2012 2011 2010 2009 Goodman 24.8% -4.2% 62.7% 2.9% 60.9% Landry -1.0% 13.2% -10.0% -0.4% 11.7% a) Calculate the average return for both companies b) Calculate standard deviation using the historical data of the returns for Goodman and Landry. Which one is more risky? c) Suppose you invest 30% in Goodman and 70% in Landry, what will be the risk of your portfolio
Step by Step Solution
There are 3 Steps involved in it
1 Expert Approved Answer
Step: 1 Unlock

Question Has Been Solved by an Expert!
Get step-by-step solutions from verified subject matter experts
Step: 2 Unlock
Step: 3 Unlock