

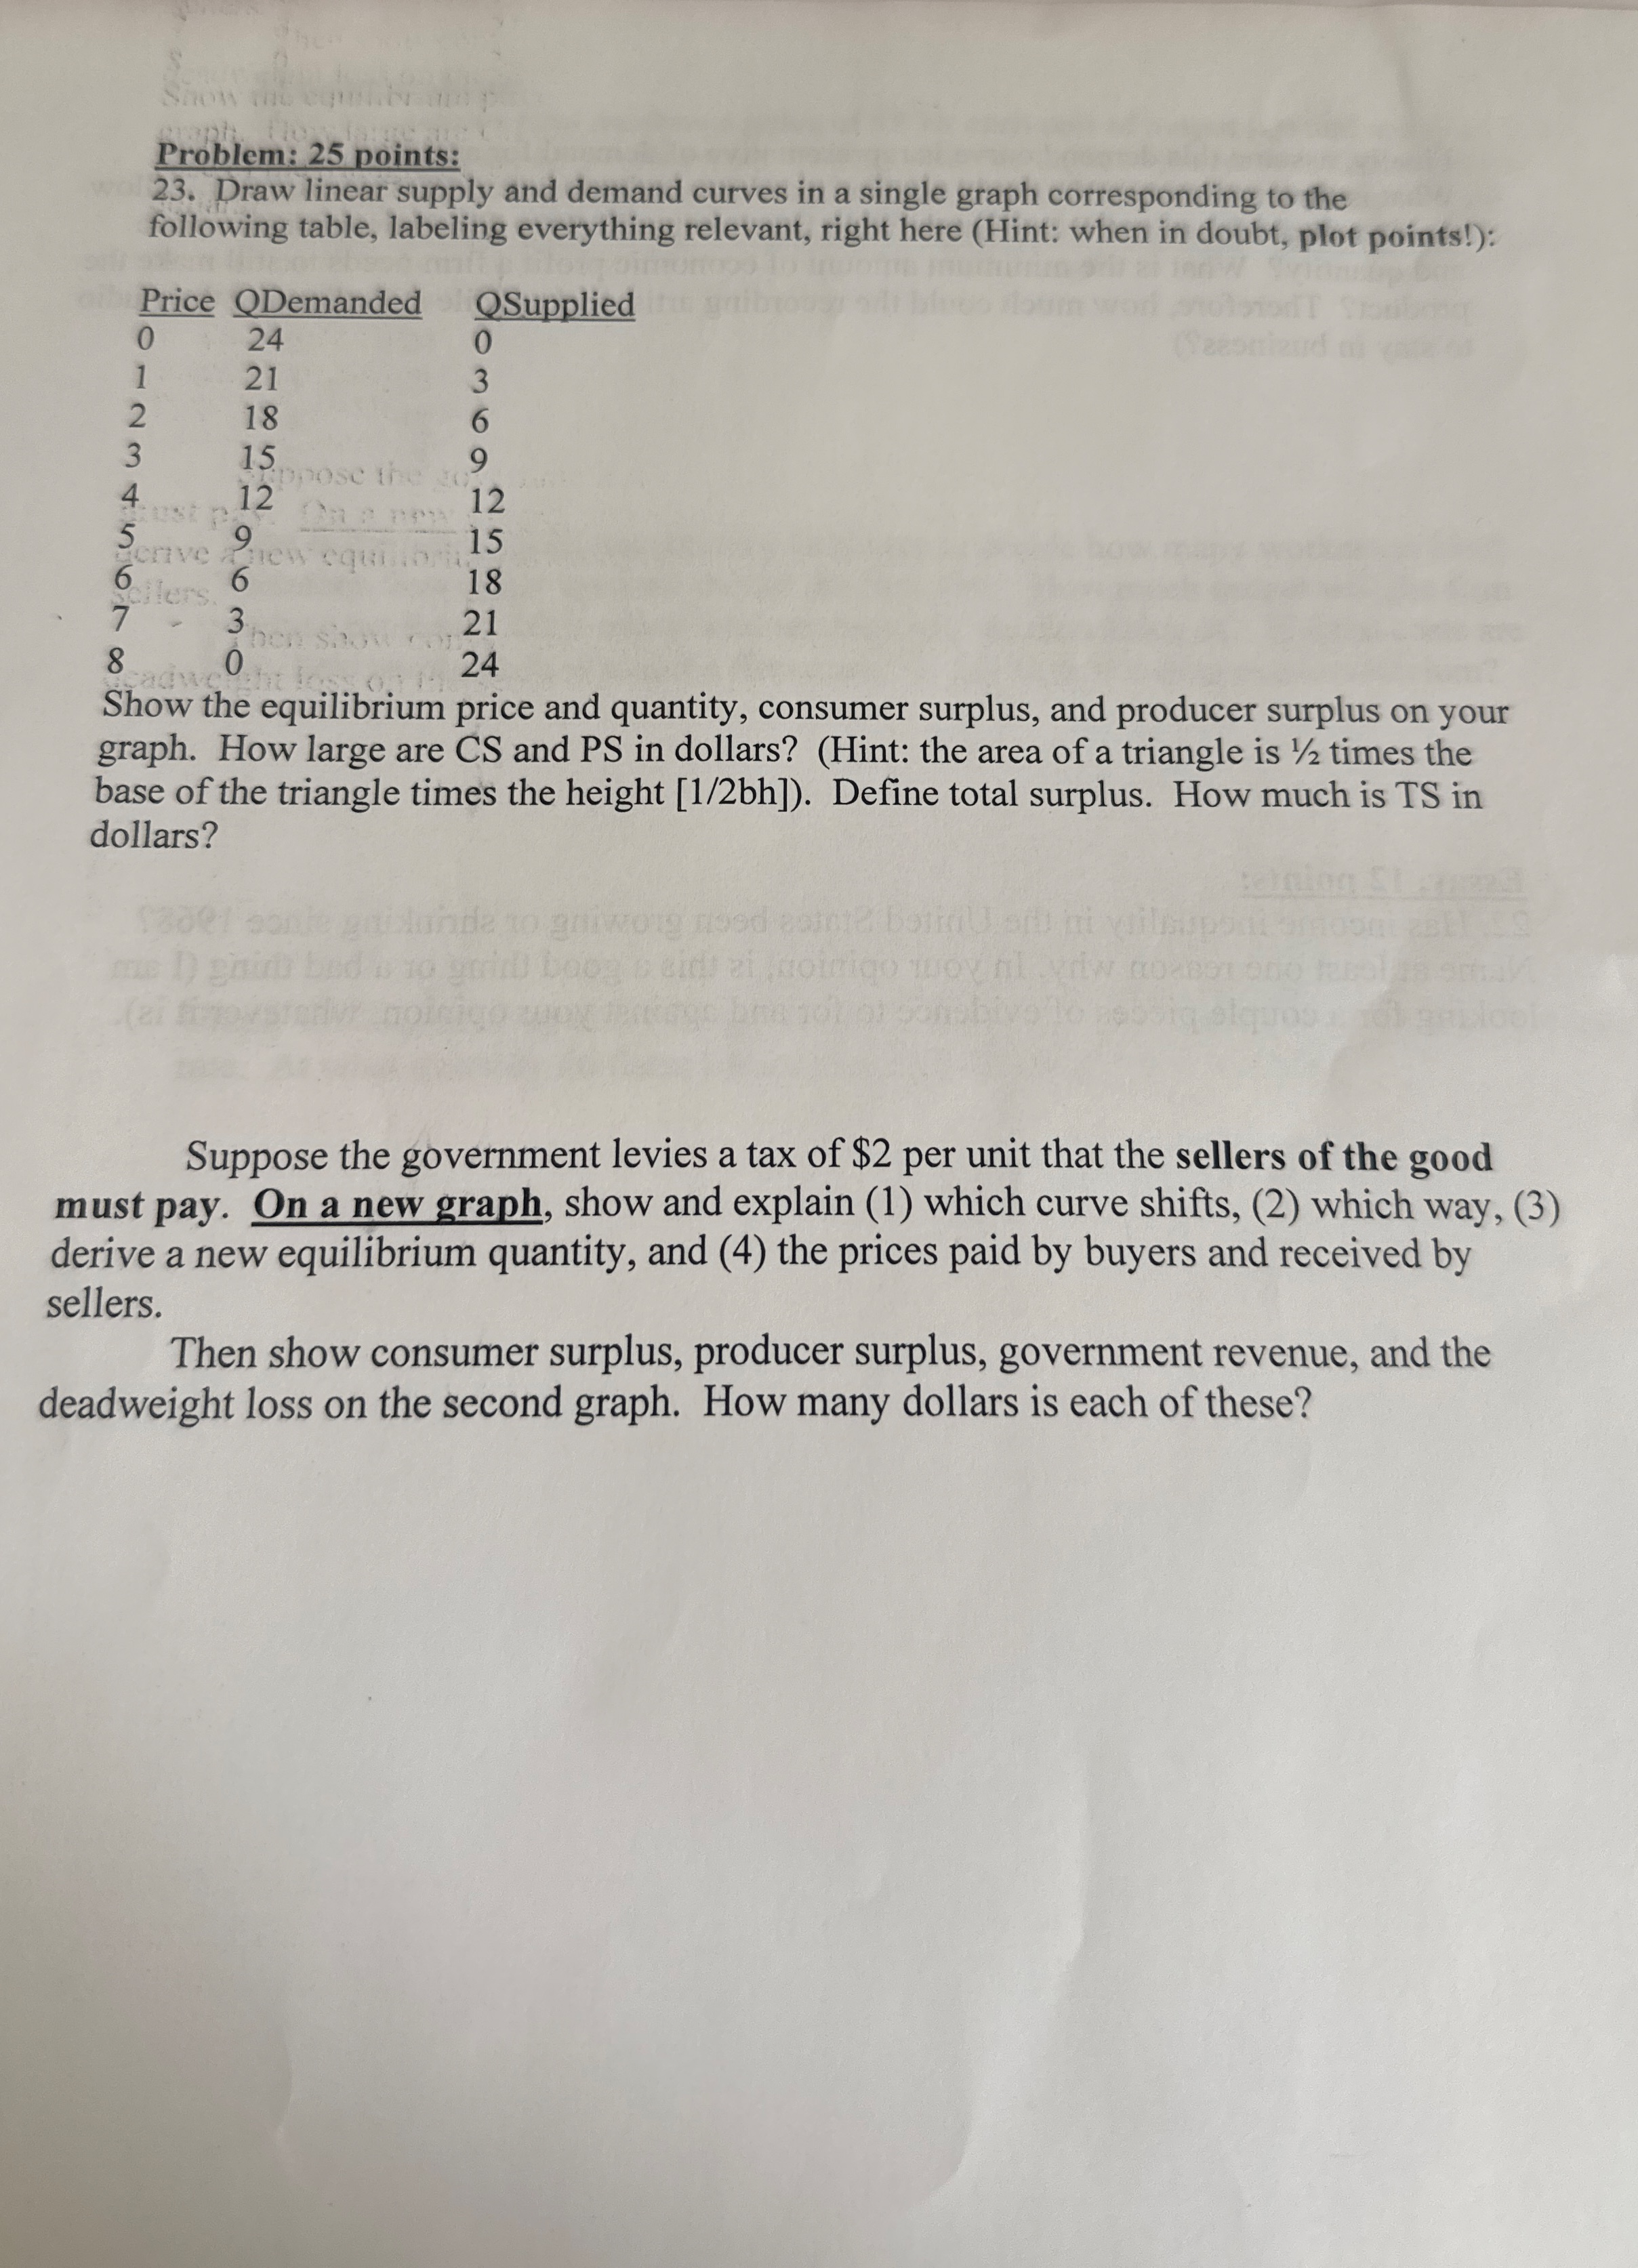
Question: Problem: 2 5 points: 2 3 . Draw linear supply and demand curves in a single graph corresponding to the following table, labeling everything relevant,
Problem: points:
Draw linear supply and demand curves in a single graph corresponding to the following table, labeling everything relevant, right here Hint: when in doubt, plot points!:
tablePriceQDemanded,QSupplied
Show the equilibrium price and quantity, consumer surplus, and producer surplus on your graph. How large are CS and PS in dollars? Hint: the area of a triangle is times the base of the triangle times the height bh Define total surplus. How much is TS in dollars?
Suppose the government levies a tax of $ per unit that the sellers of the good must pay. On a new graph, show and explain which curve shifts, which way, derive a new equilibrium quantity, and the prices paid by buyers and received by sellers.
Then show consumer surplus, producer surplus, government revenue, and the deadweight loss on the second graph. How many dollars is each of these?
Step by Step Solution
There are 3 Steps involved in it
1 Expert Approved Answer
Step: 1 Unlock

Question Has Been Solved by an Expert!
Get step-by-step solutions from verified subject matter experts
Step: 2 Unlock
Step: 3 Unlock