

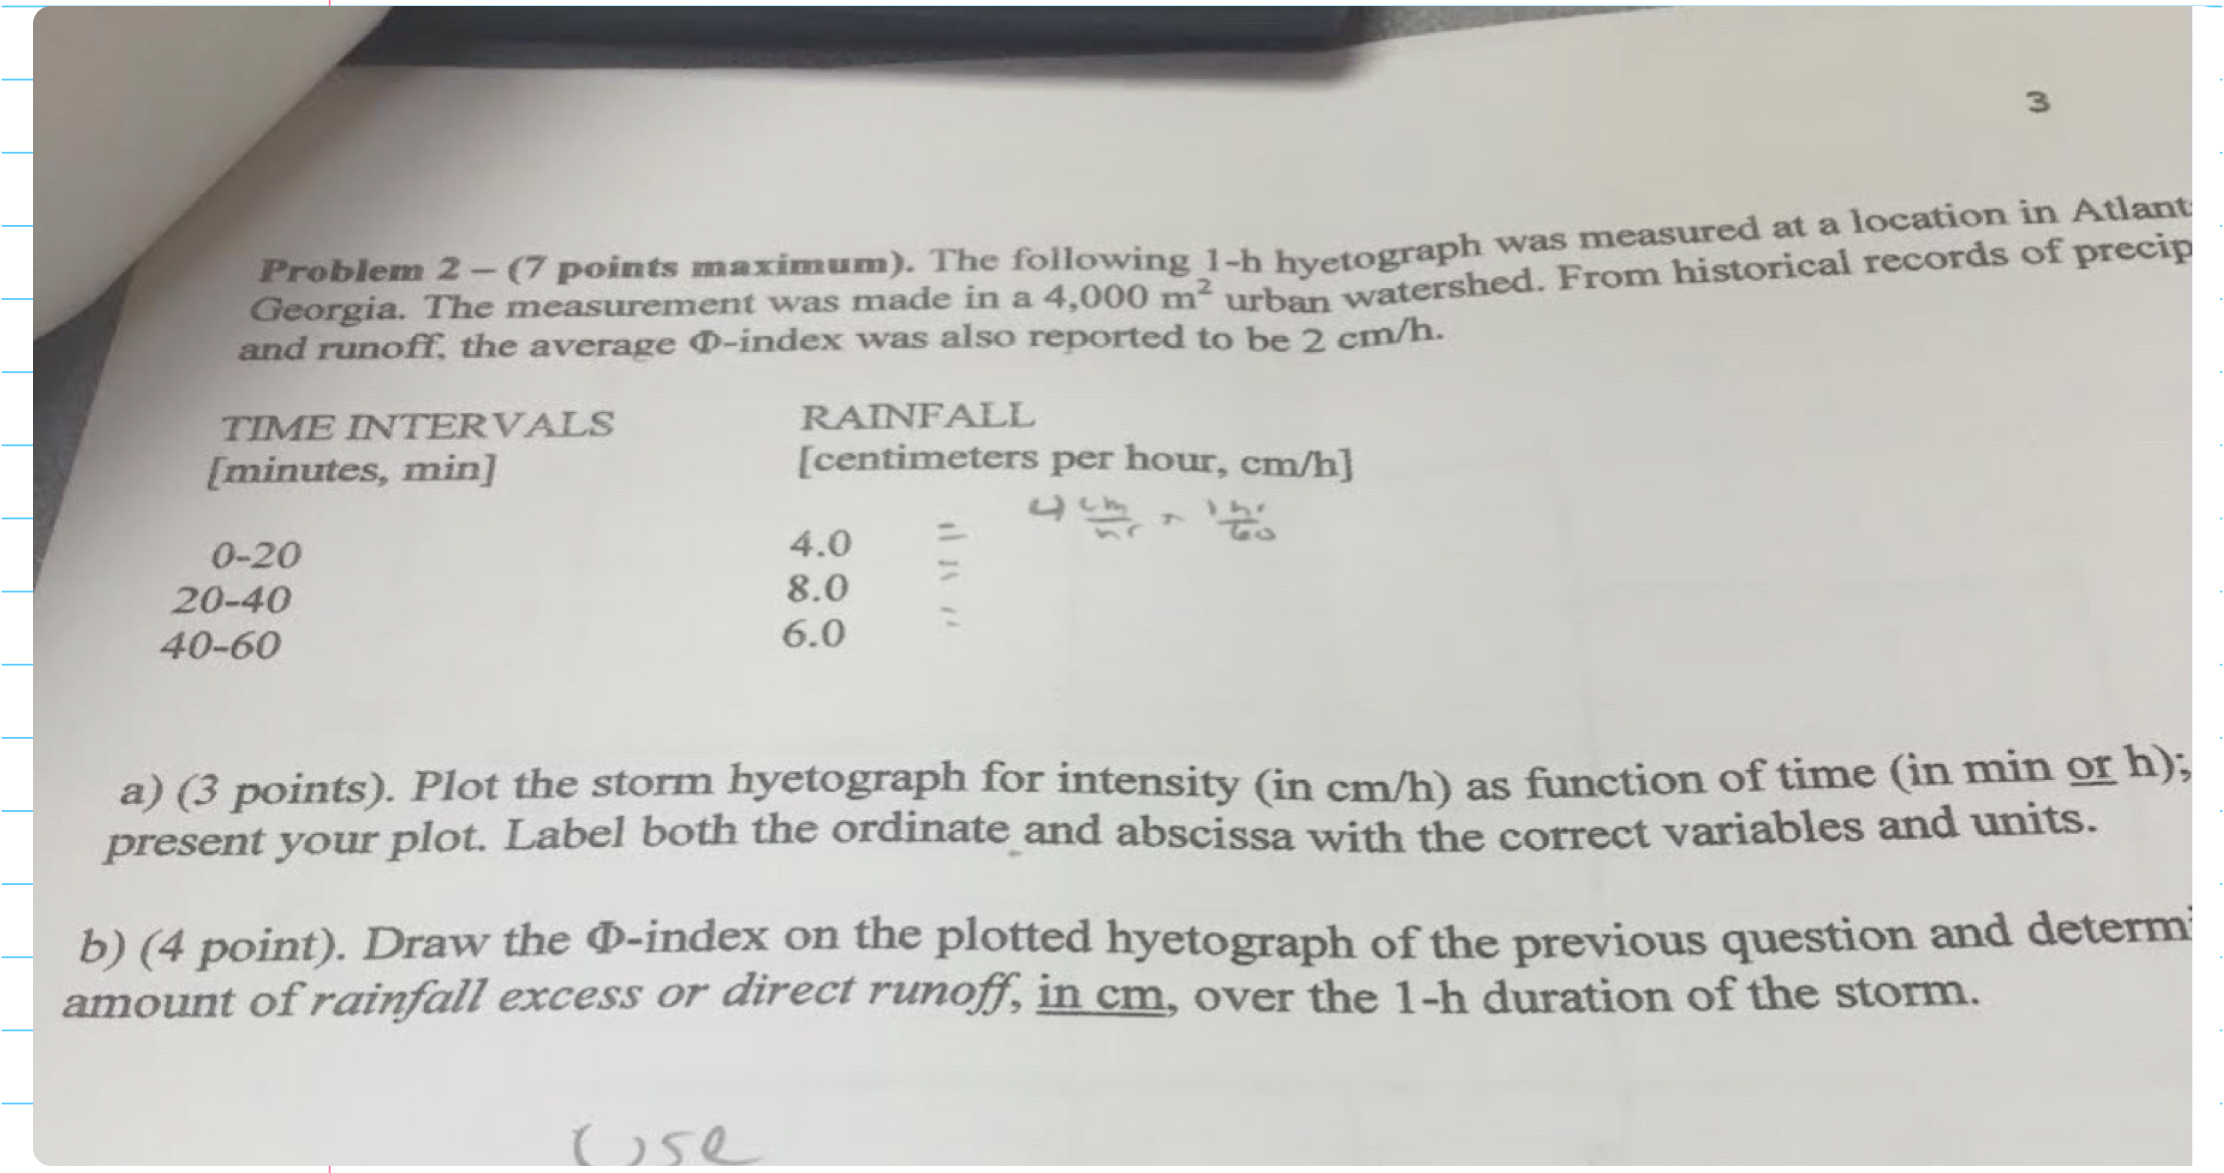
Question: Problem 2 - ( 7 points maximum ) . The following 1 - h hyetograph was measured at a location in Atlant Georgia. The measurement
Problem points maximum The following h hyetograph was measured at a location in Atlant Georgia. The measurement was made in a urban watershed. From historical records of precip and runoff, the average index was also reported to be
TIME INTER VALS
minutes min
RAINFALL
centimeters per hour,
a points Plot the storm hyetograph for intensity in as function of time in min or ; present your plot. Label both the ordinate and abscissa with the correct variables and units.
b point Draw the index on the plotted hyetograph of the previous question and determ: amount of rainfall excess or direct runoff, in over the duration of the storm.
Step by Step Solution
There are 3 Steps involved in it
1 Expert Approved Answer
Step: 1 Unlock

Question Has Been Solved by an Expert!
Get step-by-step solutions from verified subject matter experts
Step: 2 Unlock
Step: 3 Unlock