

Question: Problem 2 ( a ) Draw the graph of rainfall intensity relationship with duration at 1 0 minutes interval for a catchment is having total
Problem
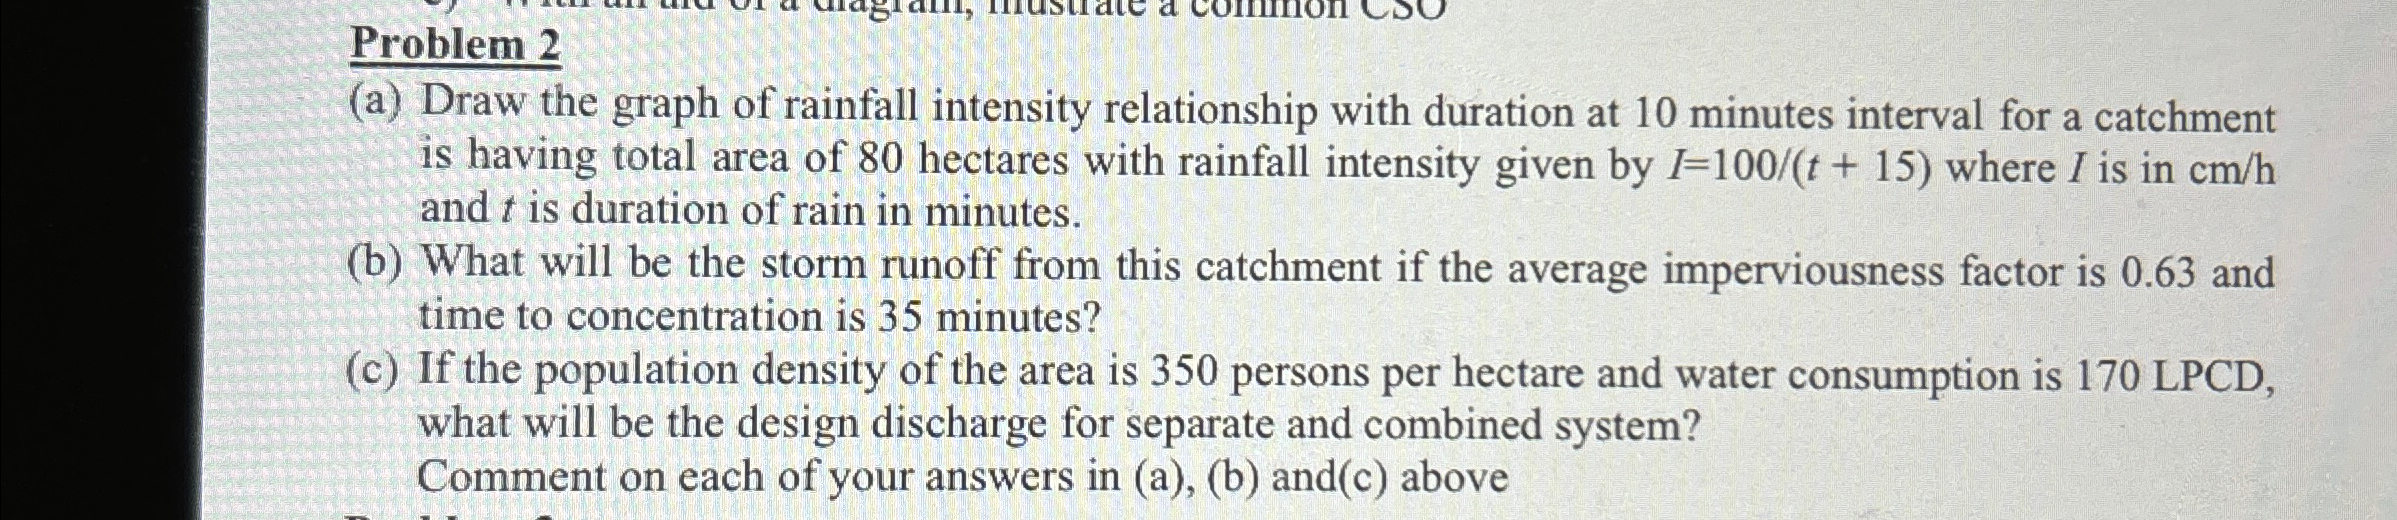
a Draw the graph of rainfall intensity relationship with duration at minutes interval for a catchment is having total area of hectares with rainfall intensity given by where I is in and is duration of rain in minutes.
b What will be the storm runoff from this catchment if the average imperviousness factor is and time to concentration is minutes?
c If the population density of the area is persons per hectare and water consumption is LPCD what will be the design discharge for separate and combined system?
Comment on each of your answers in ab andc above
Step by Step Solution
There are 3 Steps involved in it
1 Expert Approved Answer
Step: 1 Unlock

Question Has Been Solved by an Expert!
Get step-by-step solutions from verified subject matter experts
Step: 2 Unlock
Step: 3 Unlock