

Question: Problem 2 a) Manually draw a network diagram to represent the activities shown in Table 2 b) How many weeks does it take to complete
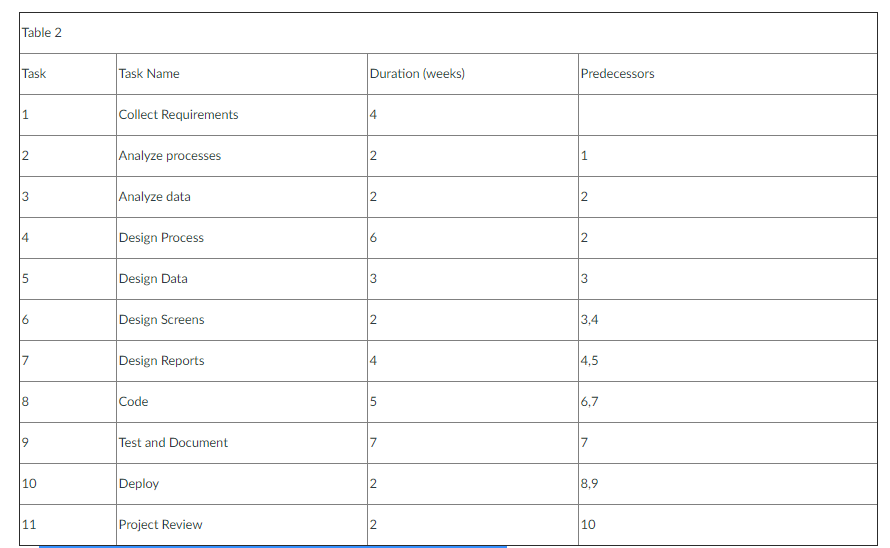
Problem 2
- a) Manually draw a network diagram to represent the activities shown in Table 2
- b) How many weeks does it take to complete the project?
- c) Assuming that the project starts on April 5th, 2021, on what specific data does the project ends?
- c) What tasks are part of the critical path?
Problem 3
Enter the project described in Table 2 in ProjectLibre (an app for organize days) and
- Generate a network diagram with MS Project and compare it with the network diagram you drew on in Problem 2.
- When is the completion date for the project?
- Explain if there are differences between the estimated duration calculated with your manually generated diagram (Problem 2) and the one completed with MS Project. Get a screen capture of the network and Gantt chart associated with this step and paste it into the Word document.
- Explain what would happen if activity 6 were revised to take six weeks instead of two weeks (hint: use MS project for this step). Get a screen capture of the network and Gantt chart associated with this step and paste it into the Word document.
Step by Step Solution
There are 3 Steps involved in it
1 Expert Approved Answer
Step: 1 Unlock

Question Has Been Solved by an Expert!
Get step-by-step solutions from verified subject matter experts
Step: 2 Unlock
Step: 3 Unlock